Basic Honeypot with Azure Sentinel Integration: Geo-Tracking Live Cyber Attacks
In cybersecurity, understanding how attackers operating is key to building effective defenses. A honeypot serves as a valuable tool for this purpose – it is a decoy system deliberately made vulnerable, with the intention of attracting attackers and revealing their tactics. Honeypots are not meant to perform any critical functions for a business but instead serve as a way to study attacker behavior, allowing security professionals to learn about the techniques and strategies attackers use without compromising their own production systems.
What is IP Geolocation? (Anfalovas, 2023)
While honeypots vary in complexity, this project aims to set up a basic honeypot in Microsoft Azure with to invite unauthorized live login attempts from attackers around the world, allowing us to observe the frequency and geographical origin of these attacks. This basic honeypot setup will not be conducting any detailed analysis or engage in deeper interaction with the attackers; rather, our focus, is on observing where the attacks are coming from and how frequently they occur.
The purpose of this project is to demonstrate a clear understanding and gain practical insights on honeypots and cloud security as cybersecurity concepts. It provides experience in setting up a vulnerable environment in Microsoft Azure and monitoring/analyzing unauthorized access attempts of attackers around the world. Moreover, this projects provides a first-time exposure to Microsoft Sentinel, which is a powerful SIEM tool used by security analysts. Becoming familiar with this powerful platform will prove to be a very valuable skill moving forward as I continue to pursue further projects in cybersecurity surrounding this tool. This project was made possible with the help of Josh Madakor’s Azure Sentinel Tutorial video foundhere, as a walkthrough/guide for me to follow when undertaking this project.
The first step in this project will be to set up our honeypot virtual machine. The assumption to this step is that you have already created a Microsoft Azure account and have created a resource group to hold all the related resources for this lab. Once this has been complete, we may begin the honeypot setup. The setup steps will be as follows:
Creating Microsoft Azure VM (Honeypot)
Creating a Log Analytics Workspace
Enabling Microsoft Defender for Cloud
Connecting Log Analytics Workspace to Honeypot
1.1 Creating Microsoft Azure VM (Honeypot)
In this step, we will be setting up a new VM to act as our honeypot, choosing an appropriate operating system (like Windows) and configuring the necessary settings (e.g., size, networking, etc.).
When creating the Azure VM, there are multiple pages/steps to go through:
Basics/Instance Details
Name, region, availability options, image, etc. all set as needed
Disks
OS disk for short-term storage (settings here left as default)
Networking
NIC Network Security Group (which acts like a firewall) must be created via the following: NIC Network Security Group > Advanced > Create new network security group
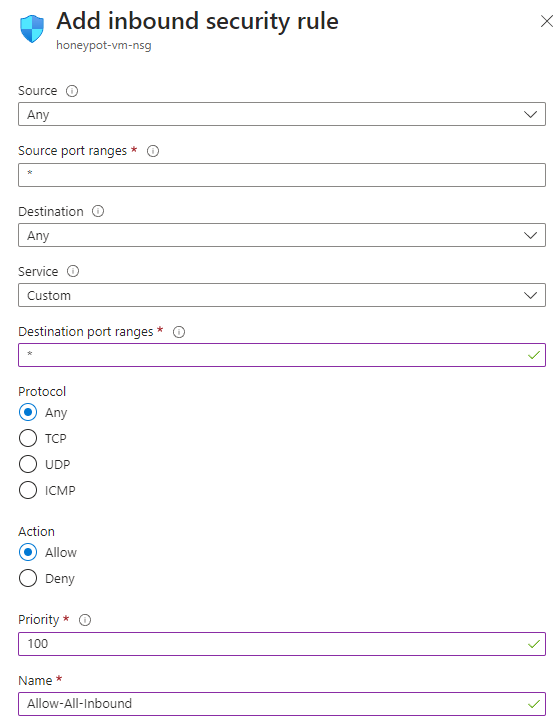
Everything in the Network Security Group will be made open to the public by (1) deleting the default inbound rule set and (2) allowing everything with the following rule:
Creating Inbound Security Rule
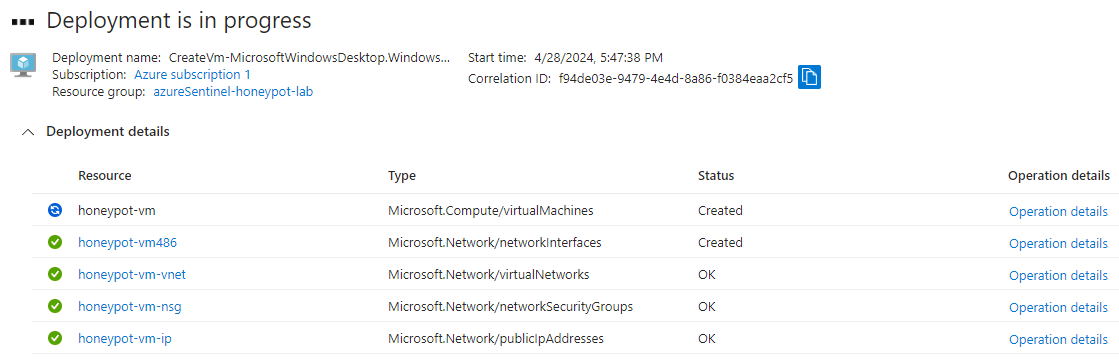
The inbound security rule above will essentially allow all incoming traffic to come in. Once this has been set, we can click Create to begin deploying the VM. This process will take just a few minutes:
Deploying Azure VM
1.2 Creating a Log Analytics Workspace
In this step, we will be creating a Log Analytics workspace to collect and analyze log data from our Azure VM. This will later be used to connect with Microsoft Sentinel.
The purpose of creating this Log Analytics Workspace is to be able to ingest Windows event logs from our honeypot VM. We will later be creating a custom log with geographic information; Azure Sentinel will connect to this workspace to display the geodata found. A Log Analytics Workspace can be created by simply typing “Log Analytics Workspaces” into the Azure portal search bar and following the steps: Create > Select a Resource Group > Create an Instance Name > Select a Region > Click “Review + Create”
Deploying Azure VM
1.3 Enabling Microsoft Defender for Cloud
In this step, we will be enabling Microsoft Defender for Cloud on our VM to ensure security monitoring and data collection.
To enable Microsoft Defender for Cloud, we can type “Microsoft Defender for Cloud” in the search bar > Management > Environment settings.
From here, we can see our Azure subscriptions. If we expand this box, we will see the following:
Microsoft Defender for Cloud | Environment Settings
If we click on our previously created Log Analytics Workspace, we will be directed to Settings | Defender Plans. To be able to store additional raw data for Windows security events, we will click on Data collection and check All Events:
Changing Windows Security Events Data Collection Settings
💡 Quick Tip: I'm unable to change my Data collection settings!It's important to note that the step above with storing additional raw data requires a change to your subscription (Defender for Cloud-Standard), as Defender for Cloud-Free does not allow these options to be managed. You will need to ensure your 30-day trial for Defender for Cloud is active.
1.4. Connecting Log Analytics Workspace to Honeypot
In this step, we will be linking our Log Analytics Workspace to our VM, allowing logs to be sent from the VM to the workspace for further analysis.
Doing this can be done by navigating via the following steps: Log Analytics Workspaces > Click on the workspace > Classic > Virtual Machines > Click on your VM
From here, we simply ensure the VM is connected to our created Log Analytics workspace by checking the Workspace Name:
Checking Log Analytics Workspace is Connected to Honeypot
If the VM is not connected, we can simply click on Connect and go through the needed steps to have this done. Once we can confirm the workspace is connected, we are ready to begin implementing Microsoft Sentinel and configuring the rest of our honeypot!
2. Adding Microsoft Sentinel to Log Analytics Workspace
In this step, we will be installing Microsoft Sentinel into our Log Analytics Workspace. This will provide additional security monitoring and analysis capabilities, ultimately allowing us to create our geodata map visualization.
To add Microsoft Sentinel to our workspace, we can do the following: Search Bar: Azure Sentinel > Click “Create Azure Sentinel” > Select our Log Analytics Workspace > Add. This will begin adding Microsoft Sentinel to our workspace. Once complete, and a dashboard for Sentinel will appear, indicating our Log Analytics Workspace is connected to Sentinel
Log Analytics Workspace Connected to Microsoft Sentinel
3. Configuring the Honeypot
The steps conducted to fully configure our honeypot will be as follows:
Logging Into the Honeypot
Accessing Windows Event Viewer
Disabling Windows Firewall
Downloading PowerShell Script for Data Retrieval
Retrieving Geolocation.io API Key and Running Script in PowerShell
3. 1. Logging Into the Honeypot
In this step, we will be using Remote Desktop Protocol (RDP) to Log into our honeypot to begin configuring the machine.
We can navigate to our virtual machine within the Azure Portal to see its essential details. Here, we want to copy our VM’s public IP address:
Viewing Our Honeypot's Public IP Address
And connect to it remotely using Remote Desktop Connection (clicking on “Use a different account”) using the username/password credentials we previously set for the VM during our setup:
RDP'ing into our VM
3. 2. Accessing Windows Event Viewer
In this step, we will be accessing Windows Event Viewer. The Event viewer will allow us to inspect logs and check for system activites (ex. failed login attempts).
Once we have logged into the VM via RDP and fully set up Windows, we can type Event Viewer into the Windows search bar. Once in Event Viewer, we can navigate to Windows Logs > Security. Here, we can see all the Windows security events occurring on the machine:
Windows Event Viewer Logs
In the screenshot above, Event IDs of 4625 are Audit Failures, indicating failed RDP login attempts. These can either come from ourselves, or from random attackers globally (as we’ve set our machine to be accessible to RDP login attempts).
Let’s purposefully create a failed login attempt with username: invalidusername when trying to RDP into our VM:
Windows Event Viewer Logs
Now, if we refresh the log page and check the Security Events, we can find our failed login attempt with invalidusername:
Our Failed Login Attempt
Scrolling further down the log will show the Source Network Address (public IP address), which will be an important data point for us to use later on. It’s important to note that there is no information on location or geographical data.
As such, we will be sending/POSTing the IP information from this log to ipgeolocation.io’s API, which will return new geographical information for us (country name, state, city, longitute/latitude, timezone, etc.). We’ll later on be using this information to create our own custom log, which we will then send to our Azure Log Analytics workspace. From there, Microsoft Sentinel will be able to read this log information and plot our where our attacks/attackers are coming from.
3. 3. Disabling Windows Firewall
In this step, we will be disabling Windows Firewall on our honeypot, making our honeypot more enticing and accessible to attackers around the world.
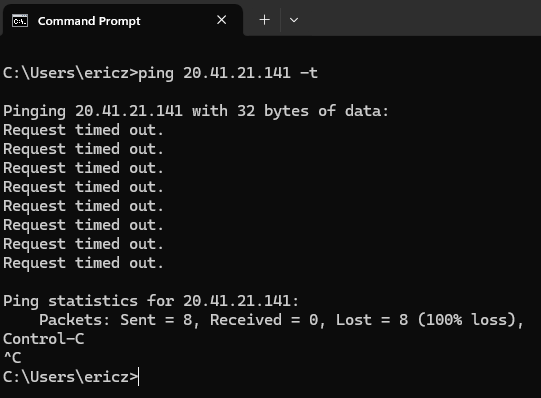
Disabling Windows Firewall will allow ICMP (ping) requests and any inbound requests to hit our honeypot much more quickly. If we try to ping our VM, we can see the ping request times out:
Ping Request Timed Out
This is because Windows Firewall (on the VM) is blocking inbound connections. We can navigate to our Windows Firewall by typing Windows Defender Firewall in the Windows search bar of our VM. From here, we can click on Advanced Settings > Windows Defender Firewall Properties:
Windows Defender Firewall Properties
Now, we can turn the firewall off for Domain, Private, and Public Profile. These profiles refer to the dfferent types of networks which our VM might be connected; each profile has specific firewall rules/settings tailored to the securtiy needs of that type of network. DomainProfile refers to when the computer is connected to a network domain (ex. Active Directory), PrivateProfile refers to when a computer is connected to a private network (a home/small office network), and Public Profile refers to when a computer is connected to a public network (any public Wi-Fi network).
For the sake of this lab, we are just going to disable Windows Defender Firewall for all of the profiles by going through each profile and setting the Firewall state to be Off. Once these settings have been set, we will see the following:
Windows Defender Firewall Properties
If we go back to the command prompt on our host machine and ping our VM this time, we should now see our pings responding:
Ping Request Response after Disabling Windows Defender Firewall
3. 4. Downloading PowerShell Script for Data Retrieval
In this step, we will be obtaining a PowerShell script to collect the attacker data hitting our honeypot.
The script we will be using is one Josh Madakor has provided for the sake of this project. It can be found here:
We can open up PowerShell ISE on our VM, create a new script, and paste the script into PowerShell. Once this has been done, we want to save that file to our desktop.
3. 5. Retrieving Geolocation.io API Key and Running PowerShell Script
In this step, we will be retrieving an API key from Geolocation.io. We will be updating our PowerShell script with this key and run the script to begin gathering geolocation data from attackers around the world.
Geolocation.io is a service/website that provides geolocation data for IP addresses, alowing developers to determine the geographical location of a user based on their IP address. Signing up for a Geolocation.io account at https://app.ipgeolocation.io will provide us with an API key – this can be found within your ipgeolocation account Dashboard.
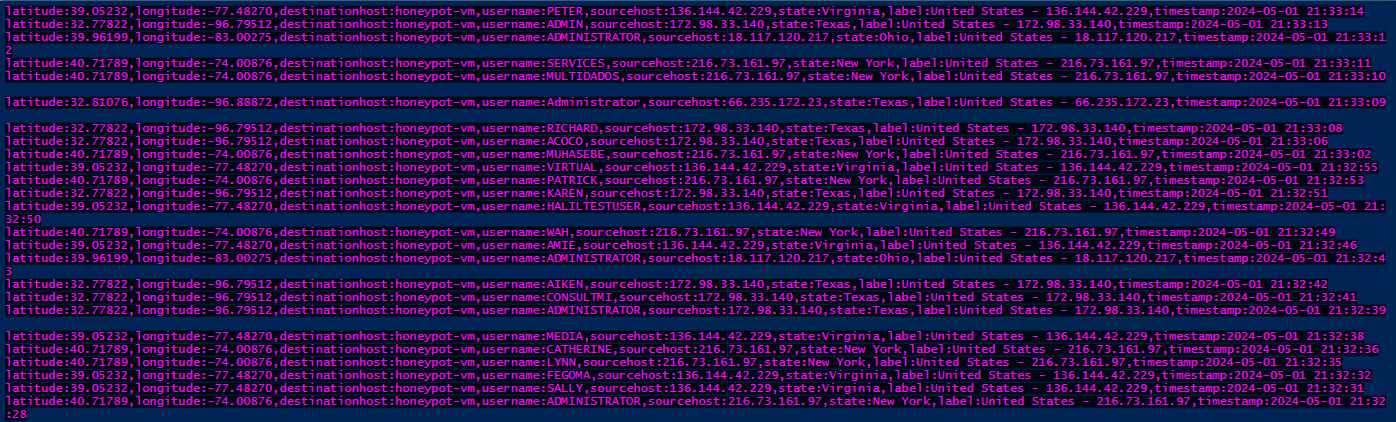
Once the API key has been added to our downloaded script, we can go ahead and run the script. From here, we will begin seeing the following failed login requests from random attackers, with their associated geo-data:
Live Attacker Geolocation Data
4. Microsoft Sentinel Setup/Customization
In this step, we will be setting up our Log Analytics workspace within Azure to in prepartion for setting up Microsoft Sentinel. This will allow us to turn of our collected logs into actionable data.
The steps conducted to fully setup and customize Microsoft Sentinel for this lab will be as follows:
Creating a Custom Log
Adding a Query
Setting Up a Map Visualization
4. 1. Creating a Custom Log
In this step, we will be creating a custom log in our Log Analytics workspace. This custom log will allow us to bring our the logs from our PowerShell script (with the geodata) into our Azure Log Analytics workspace.
We can go about create a custom log with the following steps: Azure Portal > Log Analytics workspace > Click on our Log Analytics workspace > Settings > Tables > Create > New custom log (MMA-based)
We will copy the contents of our failed_rdp.txt log from our VM (found from the indicated save path within the script) and paste it into Notepad on our host machine. From here, we will select the saved log file and import it as our Sample log as shown below:
Selecting a Sample Log for Custom Log Creation
This log we import into the Sample log will be used to help “train” our Log analytics to know what to log for in the log file. Once the sample log has been imported, the Log Analytics workspace will show the following preview for the records found within the imported log:
Imported Sample Log - Records Preview
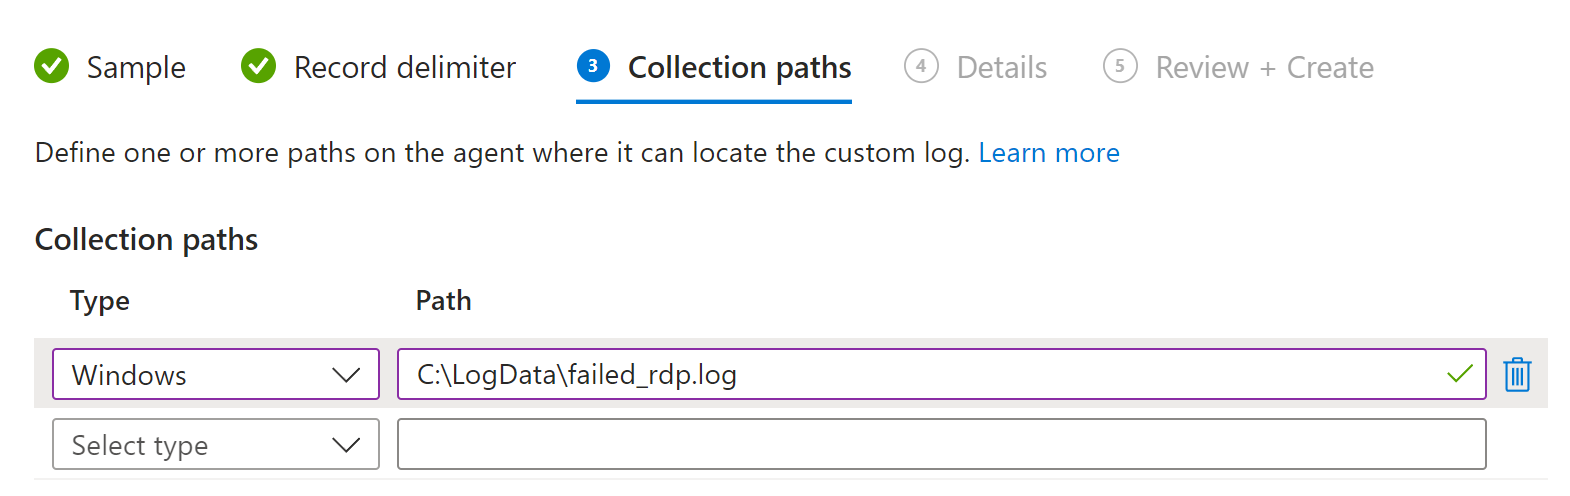
The next step is to ensure the Collection path for the log on our VM is correct Log Analytics workspace knows which path/directory to collect the log from. We will set the log’s path of C:\LogData\failed_rdp.log here:
Seting the Log Collection Path
Finally, we will be able to review the details of our new custom log, before finally clicking Create.
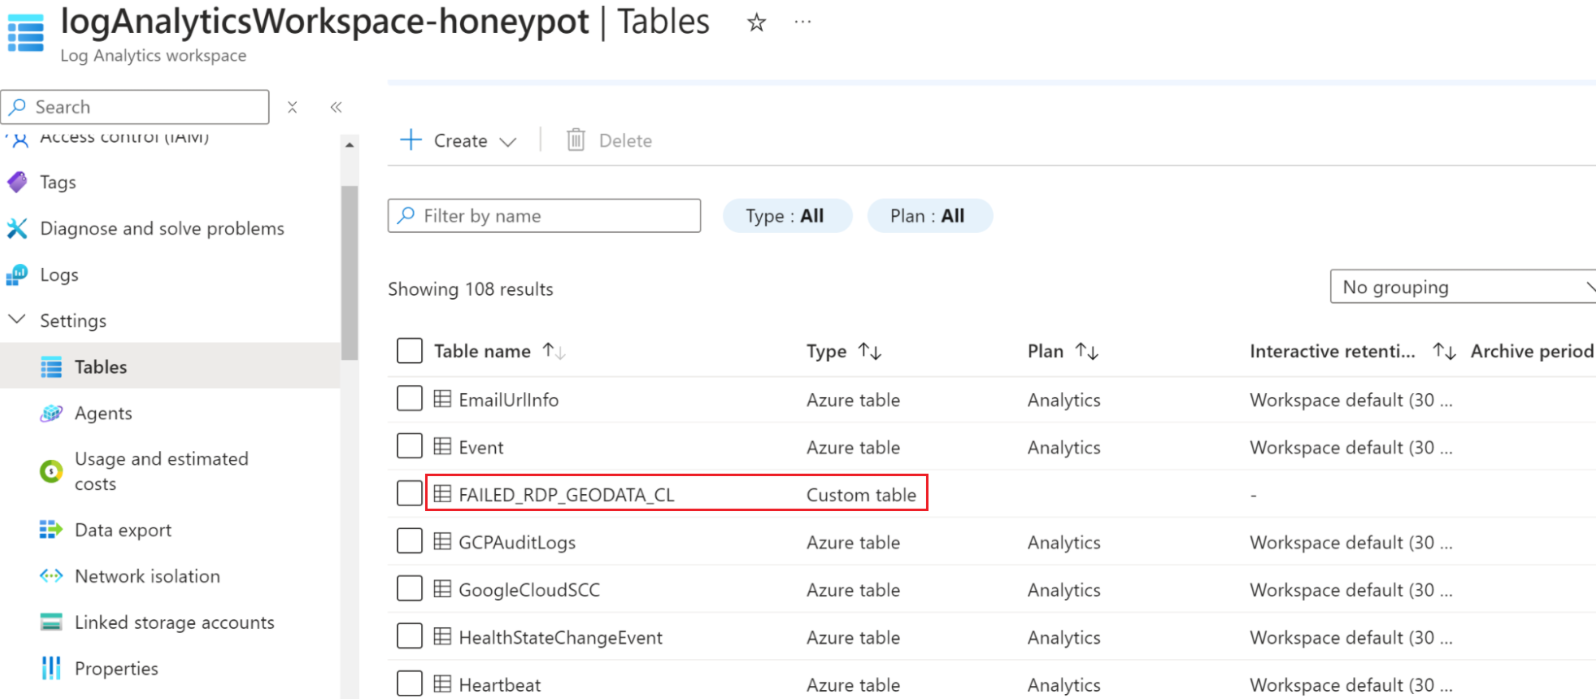
If we view our tables in the Log Analytics workspace, we can scroll down and see our new custom table/log:
Viewing Our Newly Created Custom Table/Log
With our new custom table/log created, it may take some time for it to sync up with the Log Analytics workspace. In the meantime, we can run a quick query for SecurityEvent to view the contents from Windows Event Viewer in the Security Windows Logs view. We can add a condition to our query to ensure only logs with Event ID = 4625 (login falures) show up:
Running a Query to View EventID 4625 Logs
The information shown in the Results above is the same information found when viewing our Windows Security Logs from our VM (shown below):
Running a Query to View EventID 4625 Logs
To check and see if it is all good to go with our Log Analytics workspace, we can try typing the custom log name we created before. If ready, it will autocomplete, as shown below:
Running a Query to View EventID 4625 Logs
If we go ahead and run this, we will see the following output from our log, as expected, with the RawData column essentially containing all the geo-data from our imported log from before:
Running a Query to View EventID 4625 Logs
4. 2. Adding a Query
In this step, we will be adding a query to Sentinel to extract and parse the geolocation data fields.
Our goal now is to create and add a query (with some KQL Regex) and put it into Microsoft Sentinel. This will extract and parse our geodata fields. This canvia Microsoft Sentinel > Threat
Our KQL Query Added Into Microsoft Sentinel
Running the query will provide us with an output of our geodata logs in a grid format, showing each of the extracted fields:
KQL Regex Query Output
With this, we are now ready to begin creating our Sentinel map visualization!
4. 3. Setting up a Map Visualization
In this final step, we will be configuring a map visualization in Microsoft Sentinel using the latitude and longitude values from our custom log, allowing us to visually represent where our attacks are coming from.
On Sentinel, we can create a new workbook, changing the view to be Map. When doing this, some of our data will present itself in a different visual way, after adjusting some of the Map layout settings:
Sentinel Map Visualization
Once saved, we will have this workbook in our Microsoft Sentinel, providing us with a visualization of data for the log analytics we have set up with our query. We can click on Auto Refresh and adjust the setting so that our queried log data visualization updates on the interval we’d like. As long as we ensure our PowerShell script is running on our honeypot VM, this workbook will automatically refresh with new content.
Sentinel Map Visualization
Results Achieved
Building this Azure honeypot provided the following accomplishments:
1. Fully set up an Azure honeypot through creating and configuring a Log Analytics Workspace for log/data collection, enabling Microsoft Defender for Cloud and configuring data collection to store all events.
2. Created custom logs/queries for collecting geodata, utilizing a PowerShell script with the API key from ipgeolocation.io to retrieve the initial attacker data, gaining an understanding on how such log information is collected and flows within an Azure environment.
3. Gathered real-world attacker data in the form of a map visualization, providing insight on how many attacks were conducted on a vulnerable VM in both real-time and in the form of actionable data via Sentinel’s map visualization.
After just several hours of running our PowerShell script, we are able to see the following updated values of our World Map workbook:
Sentinel Map Visualization
As noted above, we can see that the majority of our requests during this time indicated are from the United Kingdom (red), followed by the Philippines (yellow).
When we RDP into our honeypot and view the running PowerShell script, we actually notice the error log The remote server returned an error: (429) Too Many Requests populating over and over again:
PowerShell Script - (429) Too Many Requests Error
Sure enough, these requests are all coming from the same several IPs from the United Kingdom, which is the location we are receiving the most attacks from. In short, the (429) Too Many Requests error indicates that our script is sending too many requests to the ipgeolocation.io API endpoint in too short period of time (due to the high volume of attacks coming from this location). As a result, this exceeds the rate limit set by the ipgolocation.io server, resulting in this error.
To address this, we could theoretically (1) modify the script to include rate limiting to be able to handle the request, (2) batch the individual requests for each log entry together and send them eless frequently, or (3) use an alternative API that supports higher rate limits.
Closing Thoughts
Completing this basic honeypot lab was a great experience in allowing me to get hands-on experience with various tools; understanding how a SIEM tool like Microsoft Sentinel goes about collecting, analyzing, and presenting security data is a must-have skill in the field of SOC cybersecurity, and am very curious to continue exploring other popular SIEM platforms, such as Splunk.
While this lab was basic in its implementation in terms of threat intelligence gathering, I am interested to delve into creating a more involved honeypot to provide further context on an attacker’s activities. The concept of low/high-interaction honeypots and how they allow attackers to fully interact with them (allowing defenders to observe detailed behavior such as post-exploitation activities, tools used, and lateral movement techniques) is currently beyond my scope of expertise, but is definitely something I would like to understand and become involved during the growth of my career.
My current focus in cybersecurity is to further develop my foundational skills and have a strong understanding of TCP/IP networking and blue-team concepts/tools to be able to understand network architecure/defense at a high level. As a explore different honeypot types, I hope to one day implement such honeypot frameworks into the red-team side of things, leveraging them as a safe environment to test and analyze attack methods and tools.
Source Citations
Anfalovas, I. (2023, July 4). What is IP geolocation? A comprehensive guide for beginners. IPXO. https://www.ipxo.com/blog/what-is-ip-geolocation/
Josh Madakor. (2021, November 1). SIEM Tutorial for Beginners | Azure Sentinel Tutorial MAP with LIVE CYBER ATTACKS! [Video]. YouTube. https://www.youtube.com/watch?v=RoZeVbbZ0o0