Implementing a SOC Lab Environment with SIEM and Automated Case Management
Navigating the complex world of Security Operations Centers (SOC) can feel like traversing a maze of network defense and threats. Within a SOC, a constant flood of security alerts signals potential dangers. How does one effectively manage this influx of information? Enter Security Orchestration, Automation, and Response (SOAR), a solution aimed at optimizing SOC operations. SOAR coordinates and automates incident responses, integrating tools and processes into a centralized platform, empowering SOC teams to prioritize, investigate, and respond swiftly to threats, despite the relentless stream of potential vulnerabilities and attacks.
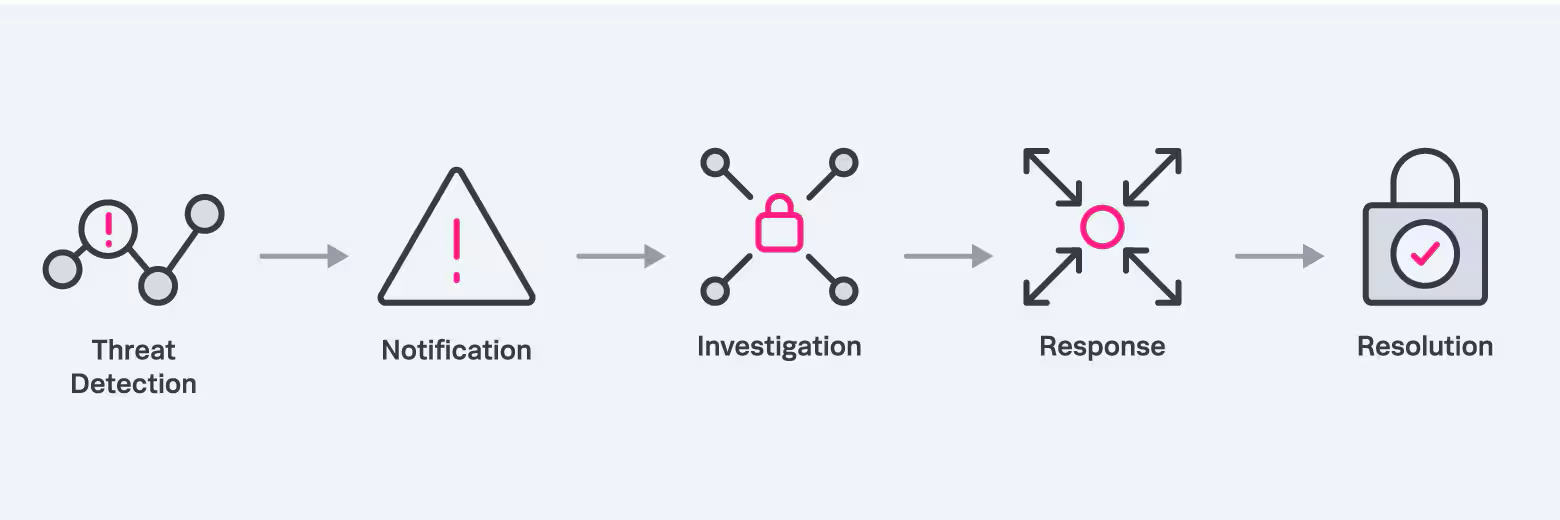
Table of Contents
Project Purpose
The purpose of this project is to build a fully functional SOC Home Lab with responsive capabilities, aiming to gain solid exposure and experience in this area of security operations with the goal of mimicing the workflow of a real SOC environment. In this project, I will showcase my initial experiences and insights into integrating some qualities of SOAR, utilizing platforms/softwares such as Wazuh, TheHive, and Shuffle to create a SOC environment that can provide automated case management tracking and notifications.
As an aspiring SOC analyst eager to explore the intricacies of cybersecurity operations, I acknowledge that although SOAR is currently beyond my professional expertise, it stands as a vital component of modern security practices within a SOC, which I am keen to investigate and master. To do this, I utilized a project walkthrough by MyDFIR to complete this project. This incredible series allowed me to partake in learning about these tools and technologies in a hands-on way, and I extend my thanks to him for his guidance.
Tools and Technologies Employed
- Oracle VirtualBox
- Windows 10 ISO (used to setup the client machine)
- Digital Ocean (cloud provider used to host and deploy our various services/applications)
- PuTTY (open-source SSH client for connecting to our servers)
Step-by-Step Walkthrough
Below is a detailed overview of the project’s steps:
1. Windows Virtual Machine and Cloud Application Setup/Installation
1. 1. Setting Up Windows 10 Virtual Machine and Installing Sysmon
Our first step will be to create our Windows 10 Virtual Machine, which will act as a test machine that we will connect to our workflow. This is where our telemetry will be generated, and later on be monitored via our Wazuh agent (installed on the machine). A similar process to this was done in my Building an Active Directory Environment project writeup in step 4. 1. Mounting and Installing Windows 10 ISO, and the needed steps can be referenced from there.
Once our Windows 10 machine has been fully configured, we can go about installing Sysmon. Sysmon is a Windows system service that monitors and logs system activity to the Windows event log. As such, it provides detailed information about various forms of activity on a device and overall enhances the visibility to help users/organizations better detect and respond to security threats. To install Sysmon, I utilized the following video tutorial in its entirety: Cybersecurity Tool: Sysmon Installation Tutorial.
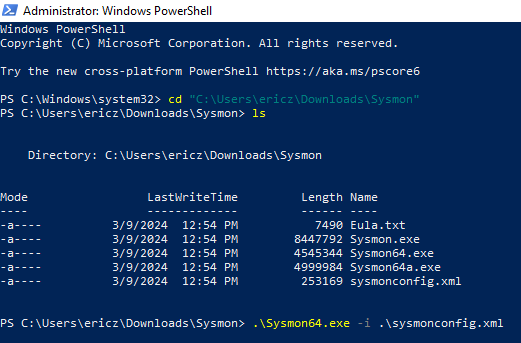
Sysmon64.exe can be downloaded via https://learn.microsoft.com/en-us/sysinternals/downloads/sysmon
Sysmonconfig.xml (also required to install sysmon) can be downloaded via https://github.com/olafhartong/sysmon-modular/blob/master/sysmonconfig.xml
Once both sysmon64.exe and sysmonconfig.xml have been downloaded and placed in the same directory, we can navigate to that directory through PowerShell and run the -i parameter to finally install sysmon:
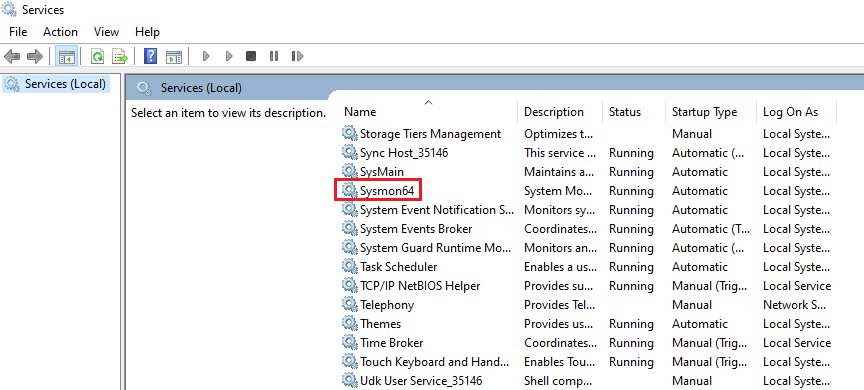
We can check if Sysmon has been installed by navigating through Event Viewer > Applications and Services > Microsoft > Windows > Finding The Application. Sysmon can similarly be found by typing Services in the Windows search bar:
1. 2. Setting Up Services on the Cloud via Digital Ocean (Wazuh and TheHive Installation)
We can start setting up our Wazuh and TheHive servers on the cloud by creating a Digital Ocean account. Once registered, we can create our first virtual machine for our Wazuh server via Create > Droplets. You will then see the following setup page:
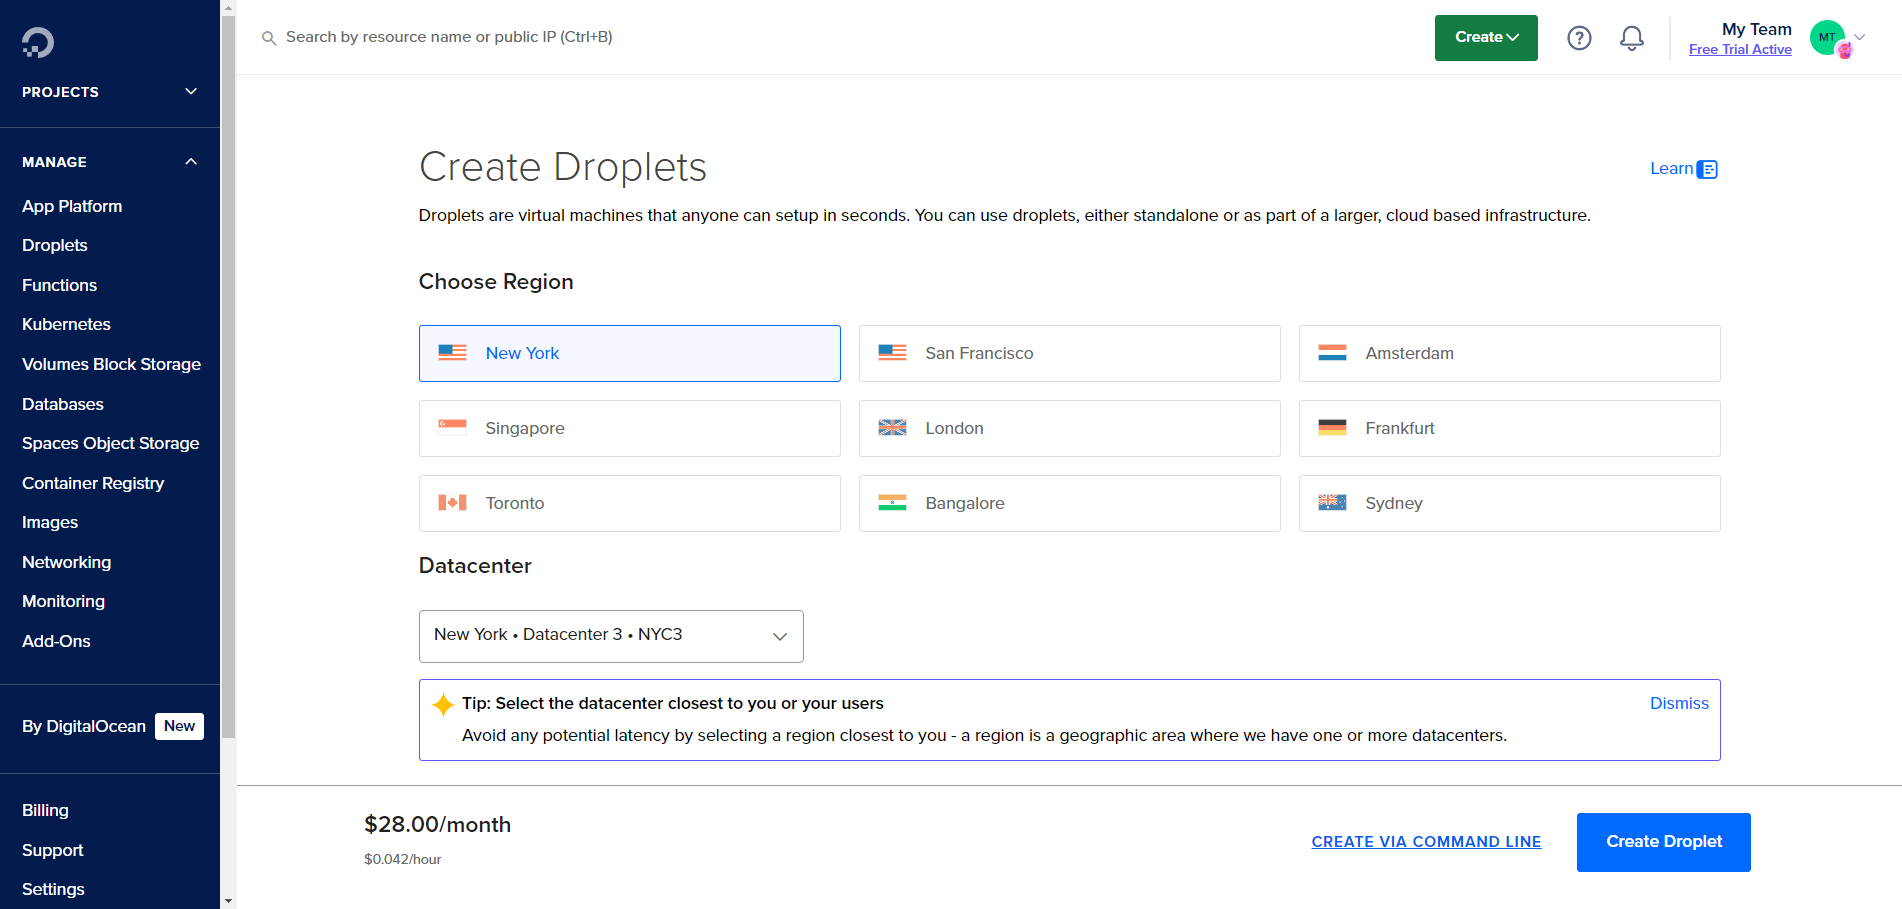
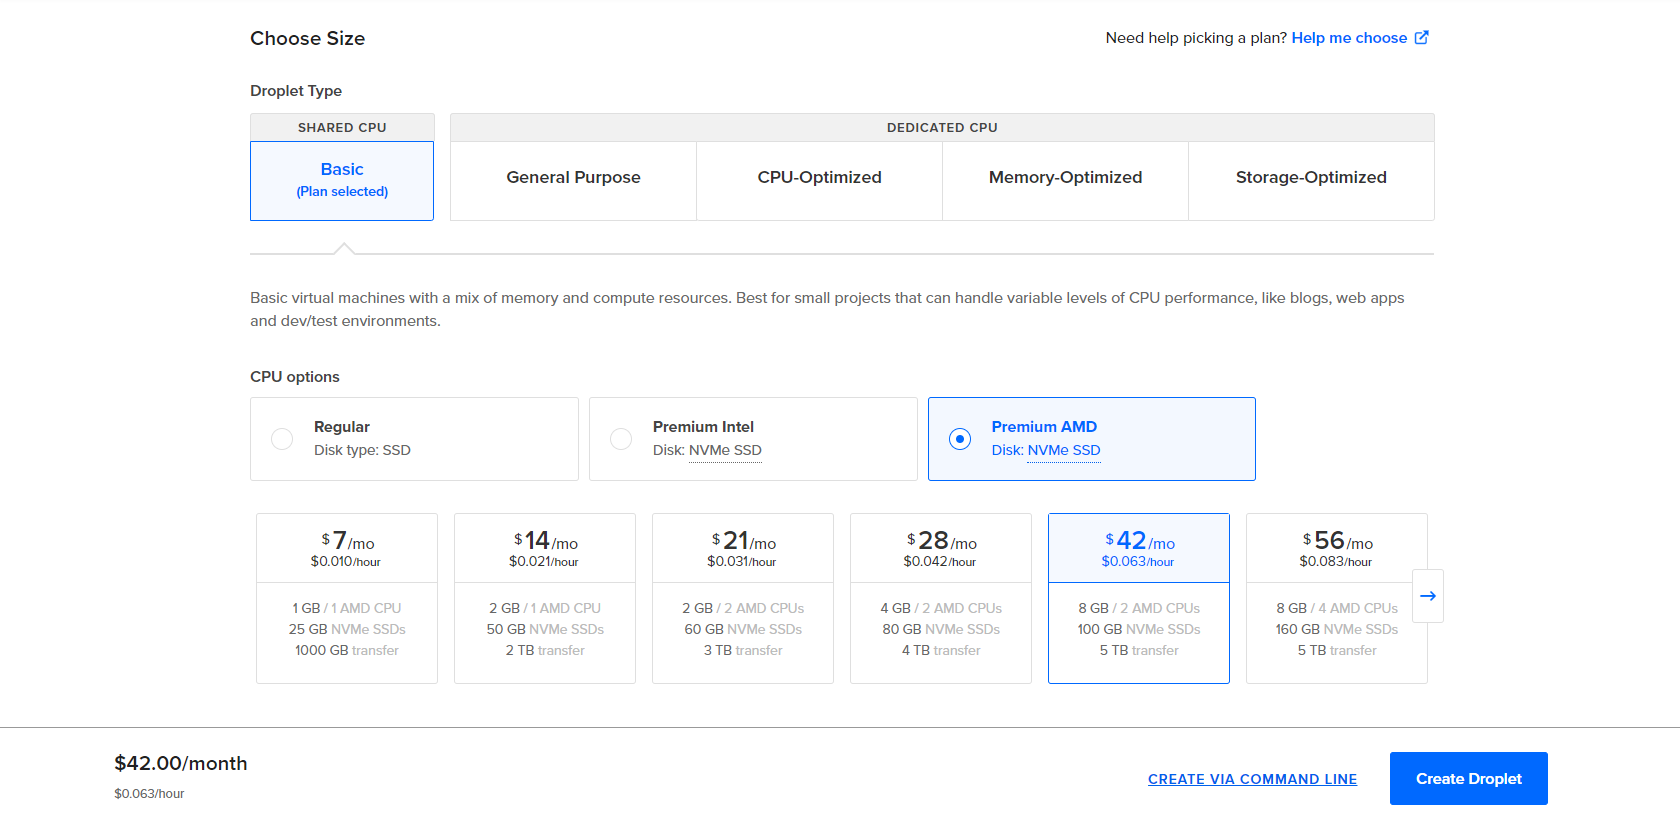
During this setup, the settings/options selected are as follows:
- Image: Ubuntu v22.04 x64
- Droplet Type: Basic
- CPU Options: Premium AMD, 8GB
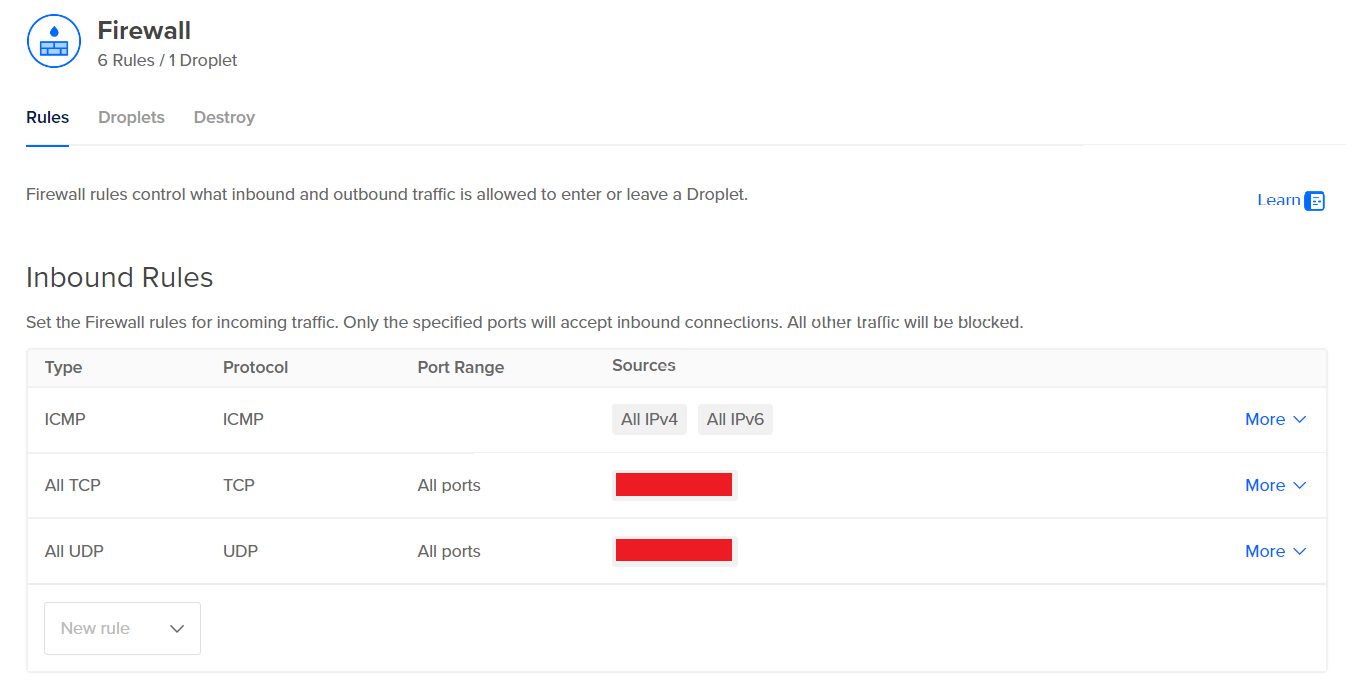
Once this droplet has been created, we can configure a cloud firewall on Digital Ocean to protect our Wazuh VM from unnecessary inbound traffic. This can be done through Networking > Firewalls > Create Firewall.
Since we will be using this firewall for our Droplets, we want to add our public IP to the inbound rules so that traffic from our host machine is allowed when accessing our Droplets:
Now that our firewall has been created and configured, we can go ahead and log into our VM. Typically, this can be done by Clicking on the Droplet > Access > Launch Droplet Console. Notice that we also see our Droplet’s public IPv4 address at the top right
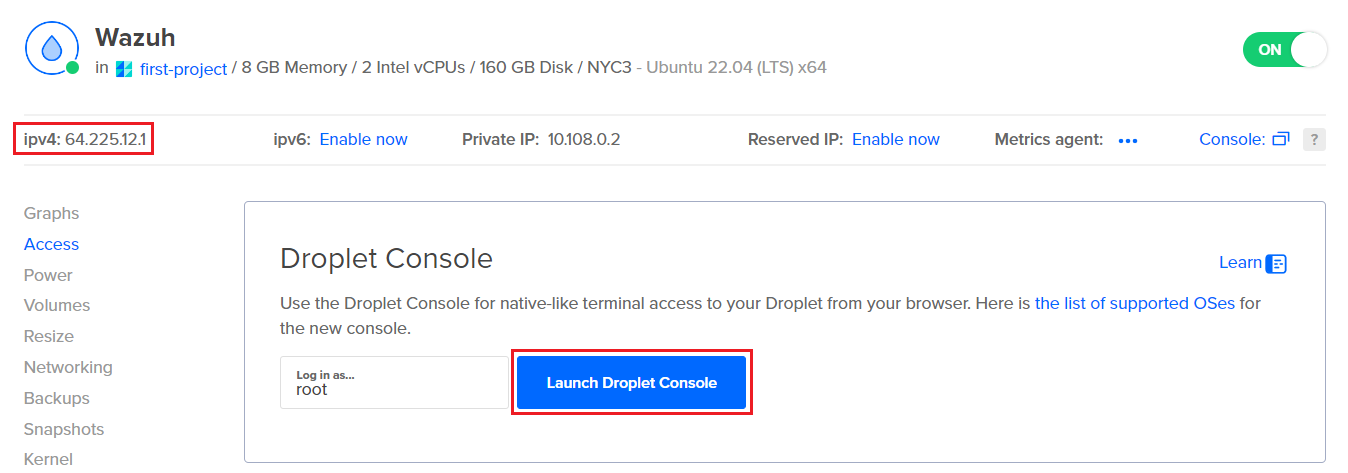
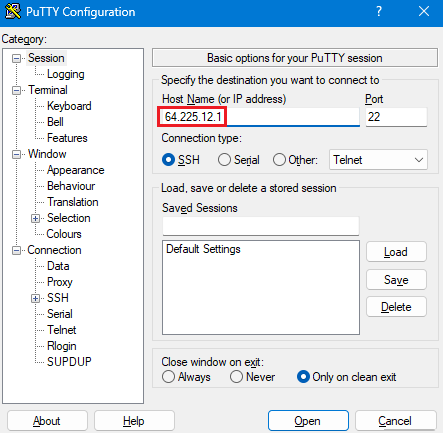
I was unable to launch the Droplet console directly from Digital Ocean; instead, I decided to use the open source SSH/Telnet client PuTTY to access the Droplets. PuTTY can be installed by following the instructions at https://www.putty.org. When opening up PuTTY, we can enter in the public IPv4 address shown above and connect with our username and password (which we previously set during Droplet configuration):
Once authenticated, we can begin running the needed commands on our Wazuh server to begin setting it up:
Performing updates/upgrades on Wazuh Machine
$ apt-get update && apt-get upgrade -y
Installing Wazuh
$ curl -sO https://packages.wazuh.com/4.7/wazuh-install.sh && sudo bash ./wazuh-install.sh -a
Wazuh will begin installing, and will eventually provide us with a username, password, and a message indicating that the installation has finished:
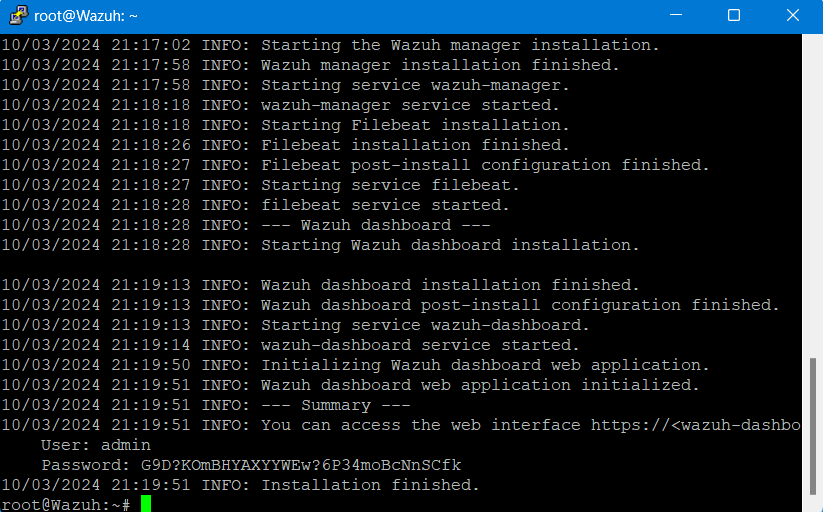
After seeing this page, we can log into our Wazuh dashboard by inputting the IPv4 address of our Wazuh Droplet into our browser to arrive at the Wazuh login page, where we can enter our credentials from above to log in.

Now that we have our Wazuh service up and verified to be running, we can now go ahead and up our TheHive server. To do this, the same procedures from above used to set up our Wazuh Droplet can be referenced and followed. Once we have received our IP for our TheHive server and SSH’d via PuTTY, we can go ahead and begin configuring the server.
There are four components that we must install on TheHive for it to properly work:
1. Java (powers the backend infrastructure and enables integration with other services/tools)
2. Cassandra (used for TheHive’s database)
3. Elastic Search (manages data indices, which are used to query data)
4. TheHive (the platform itself)
Installing Java
$ wget -qO- https://apt.corretto.aws/corretto.key | sudo gpg --dearmor -o /usr/share/keyrings/corretto.gpg
$ echo "deb [signed-by=/usr/share/keyrings/corretto.gpg] https://apt.corretto.aws stable main" | sudo tee -a /etc/apt/sources.list.d/corretto.sources.list
$ sudo apt update
$ sudo apt install java-common java-11-amazon-corretto-jdk
$ echo JAVA_HOME="/usr/lib/jvm/java-11-amazon-corretto" | sudo tee -a /etc/environment
$ export JAVA_HOME="/usr/lib/jvm/java-11-amazon-corretto"
Installing Cassandra
$ wget -qO - https://downloads.apache.org/cassandra/KEYS | sudo gpg --dearmor -o /usr/share/keyrings/cassandra-archive.gpg
$ echo "deb [signed-by=/usr/share/keyrings/cassandra-archive.gpg] https://debian.cassandra.apache.org 40x main" | sudo tee -a /etc/apt/sources.list.d/cassandra.sources.list
$ sudo apt update
$ sudo apt install cassandra
Installing Elastic Search
$ wget -qO - https://artifacts.elastic.co/GPG-KEY-elasticsearch | sudo gpg --dearmor -o /usr/share/keyrings/elasticsearch-keyring.gpg
$ sudo apt-get install apt-transport-https
$ echo "deb [signed-by=/usr/share/keyrings/elasticsearch-keyring.gpg] https://artifacts.elastic.co/packages/7.x/apt stable main" | sudo tee /etc/apt/sources.list.d/elastic-7.x.list
$ sudo apt update
$ sudo apt install elasticsearch
Installing TheHive
$ wget -O- https://archives.strangebee.com/keys/strangebee.gpg | sudo gpg --dearmor -o /usr/share/keyrings/strangebee-archive-keyring.gpg
$ echo 'deb [signed-by=/usr/share/keyrings/strangebee-archive-keyring.gpg] https://deb.strangebee.com thehive-5.2 main' | sudo tee -a /etc/apt/sources.list.d/strangebee.list
$ sudo apt-get update
$ sudo apt-get install -y thehive
2. Configuring Our TheHive Server
The steps to complete in this second part will be as follows:
2. 1. Configuring TheHive - Cassandra
First, we will be editing Cassandra’s config file – all the actions below will be conducted while we are SSH’d into our TheHive server. The config file can be found/edited with the following command:
Editing Cassandra's config file
$ nano /etc/cassandra/cassandra.yaml
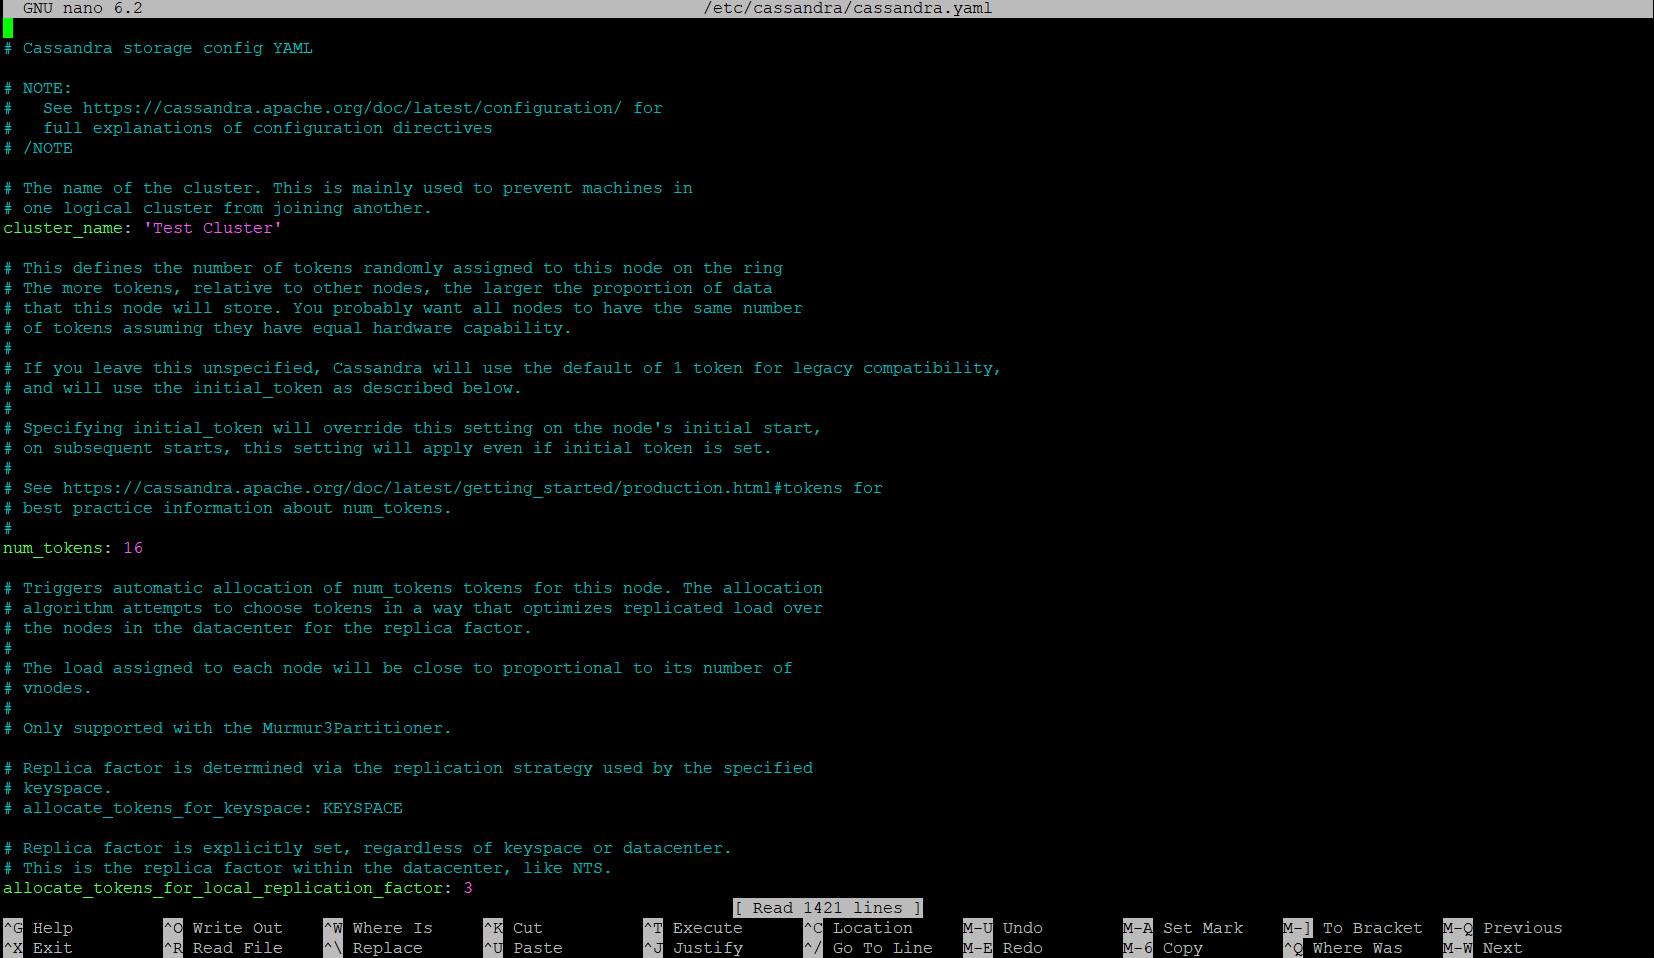
This file will be where various parameters/values can be adjusted. We will be setting the following values:
Cluster_name = TheHive Cluster
listen_address = <Public IP of our TheHive Droplet>
Rpc_address = <Public IP of our TheHive Droplet>
Seed_provider = <Public IP of our TheHive Droplet + Default Port>
There are also some old files on Cassandra, since we installed TheHive with its package/files. To get rid of these, we will first (1) stop Cassandra, (2) remove the old files, and finally (3) start the Cassandra service again and check its status:
Stopping Cassandra service
$ systemctl stop cassandra.service
Removing old files in Cassandra
$ rm -rf /var/lib/cassandra/*
Starting Cassandra service and checking its status
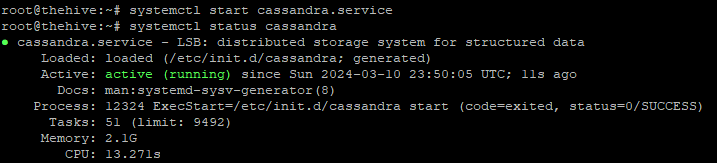
$ systemctl start cassandra.service
$ systemctl status cassandra.service
And with that, we can see that Cassandra is up and running once again:
2. 2. Configuring TheHive - Elastic Search
Next, we will be editing Elastic Search’s config file. The Elastic Search config file can be found/edited with the following command:
Editing Elastic Search's config file
$ nano /etc/elasticsearch/elasticsearch.yml
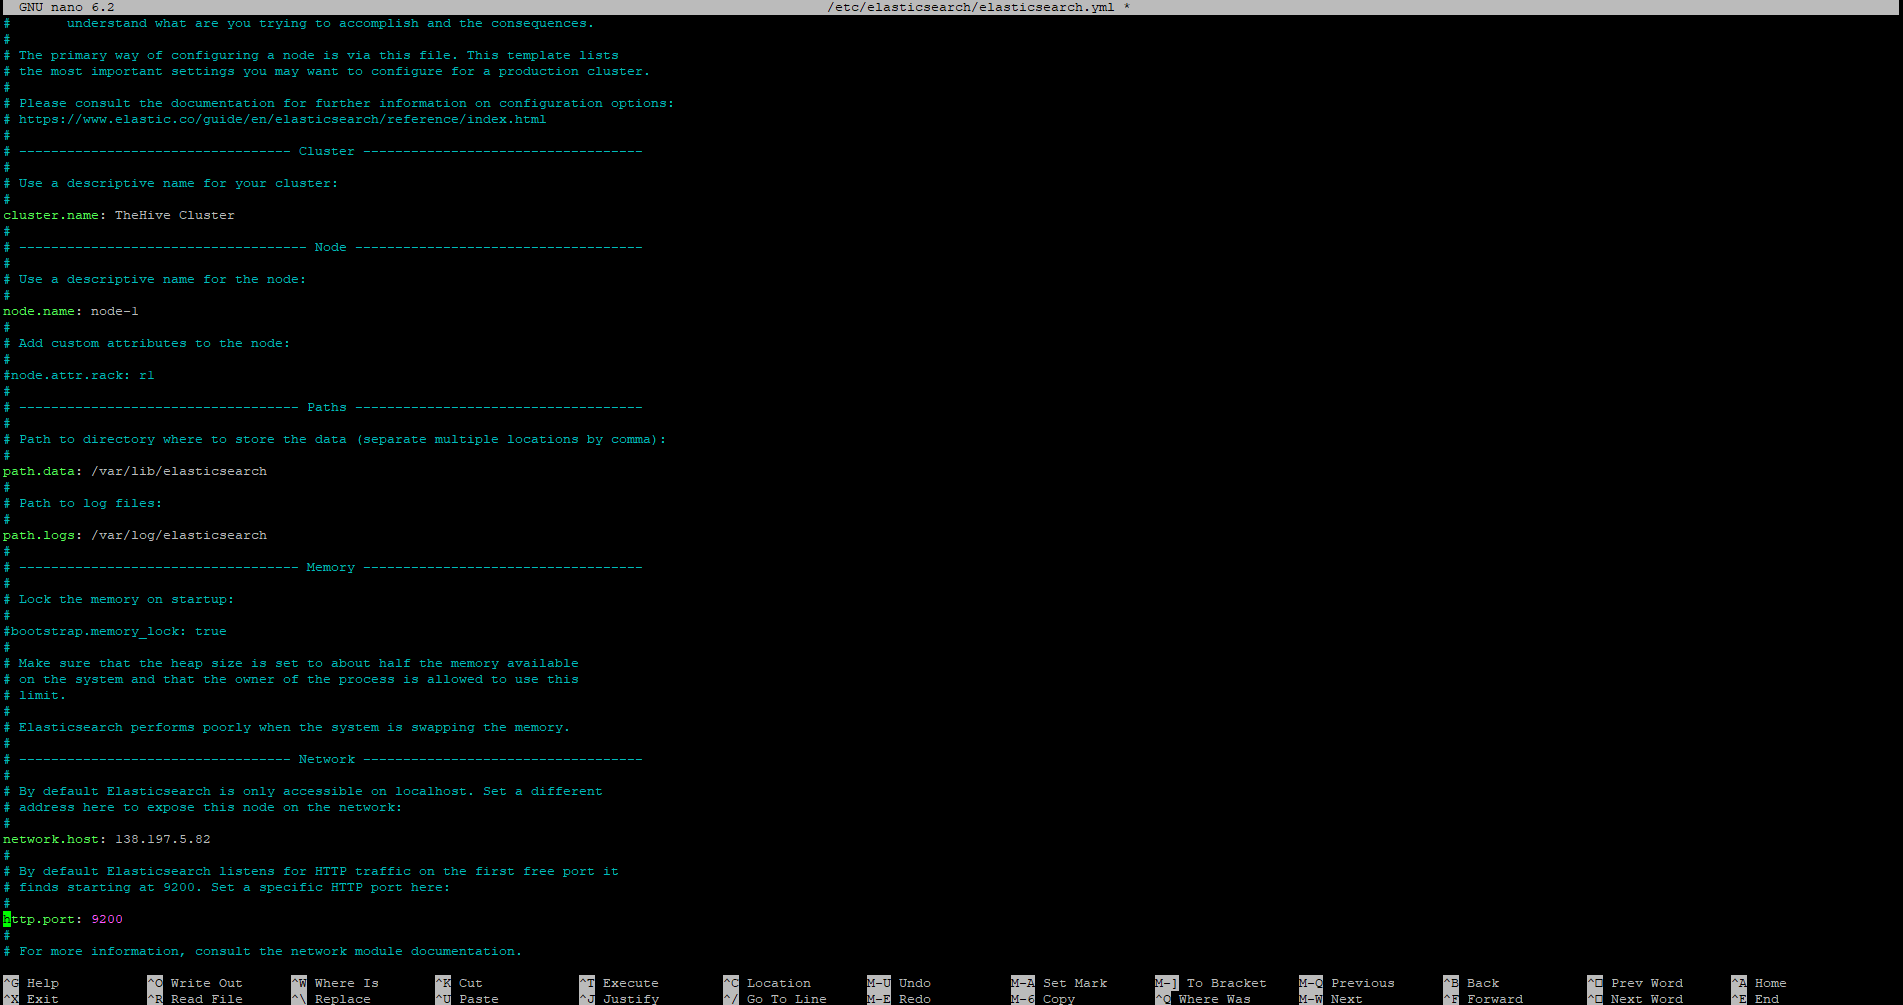
Here, we will similarly change various values within the config file. We will be setting the following values:
Uncomment cluster.name, set cluster.name = <Your TheHive cluster name>
Uncomment node.name
Uncomment network.host, set network.host = <TheHive Droplet’s public IP>
Uncomment http.port, set http.port = 9200
Uncomment cluster.initial_master_node, remove node 2
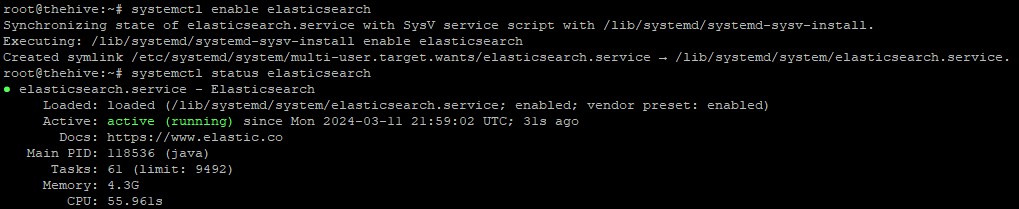
Once the settings above have been changed and saved, we can start and enable Elastic Search
Starting/Enabling Elastic Search service and checking its status
$ systemctl start elasticsearch
$ systemctl enable elasticsearch
$ systemctl status elasticsearch
2. 3. Configuring TheHive (Itself)
By default, TheHive is configured to store files locally. Before we can start configuring TheHive’s config file, we want to ensure TheHive’s user and group have access to the following file path: /opt/thp
Checking directory access to "thehive" directory
$ ls -la /opt/thp
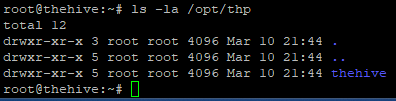
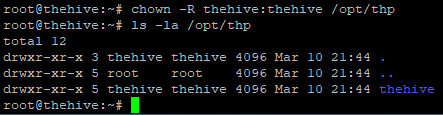
Here, we can see root has access to thehive directory; this must be changed so it is thehive user and group that have permissions. This can be done with the following command:
Changing access permissions for "thehive" directory
$ chown -R thehive:thehive /opt/thp
With this, we are now ready and able to begin making changes to TheHive’s config file.
Editing TheHive's config file
$ nano /etc/thehive/application.conf
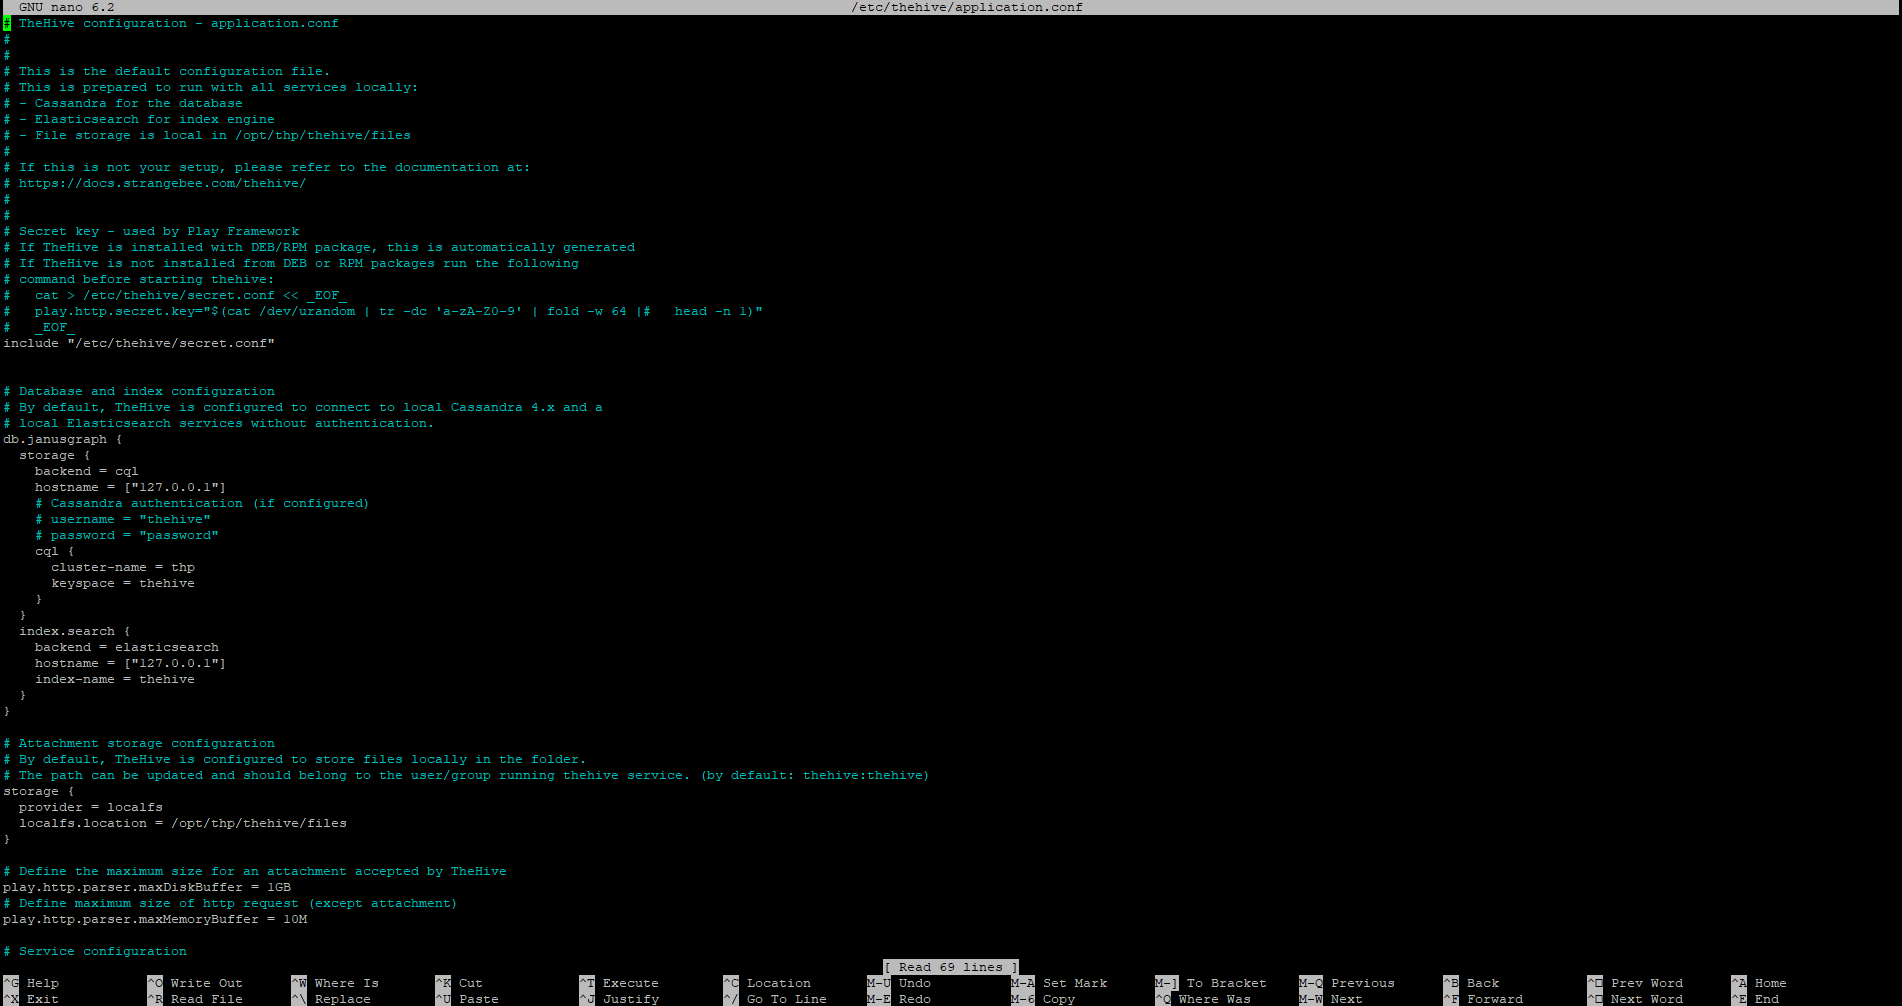
In this config file, the changes we are looking to make will be as follows:
hostname values in db.janusgraph section = <TheHive’s public IP>
cluster-name = <Your TheHive cluster name>
application.baseUrl localhost = <TheHive’s public IP>
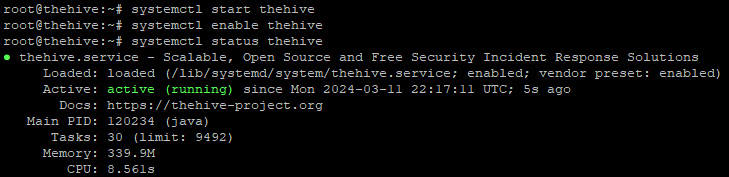
And of course, we will be restarting TheHive after changing and saving the config file settings.
Starting/Enabling TheHive service and checking its status
$ systemctl start thehive
$ systemctl enable thehive
$ systemctl status thehive
Now, we are able to access TheHive by navigating to the public IP of our TheHive Droplet with port 9000 (as previously indicated from the port number in the application.baseUrl value in our TheHive config file). Upon entering in this address, we will be met with TheHive’s login page:
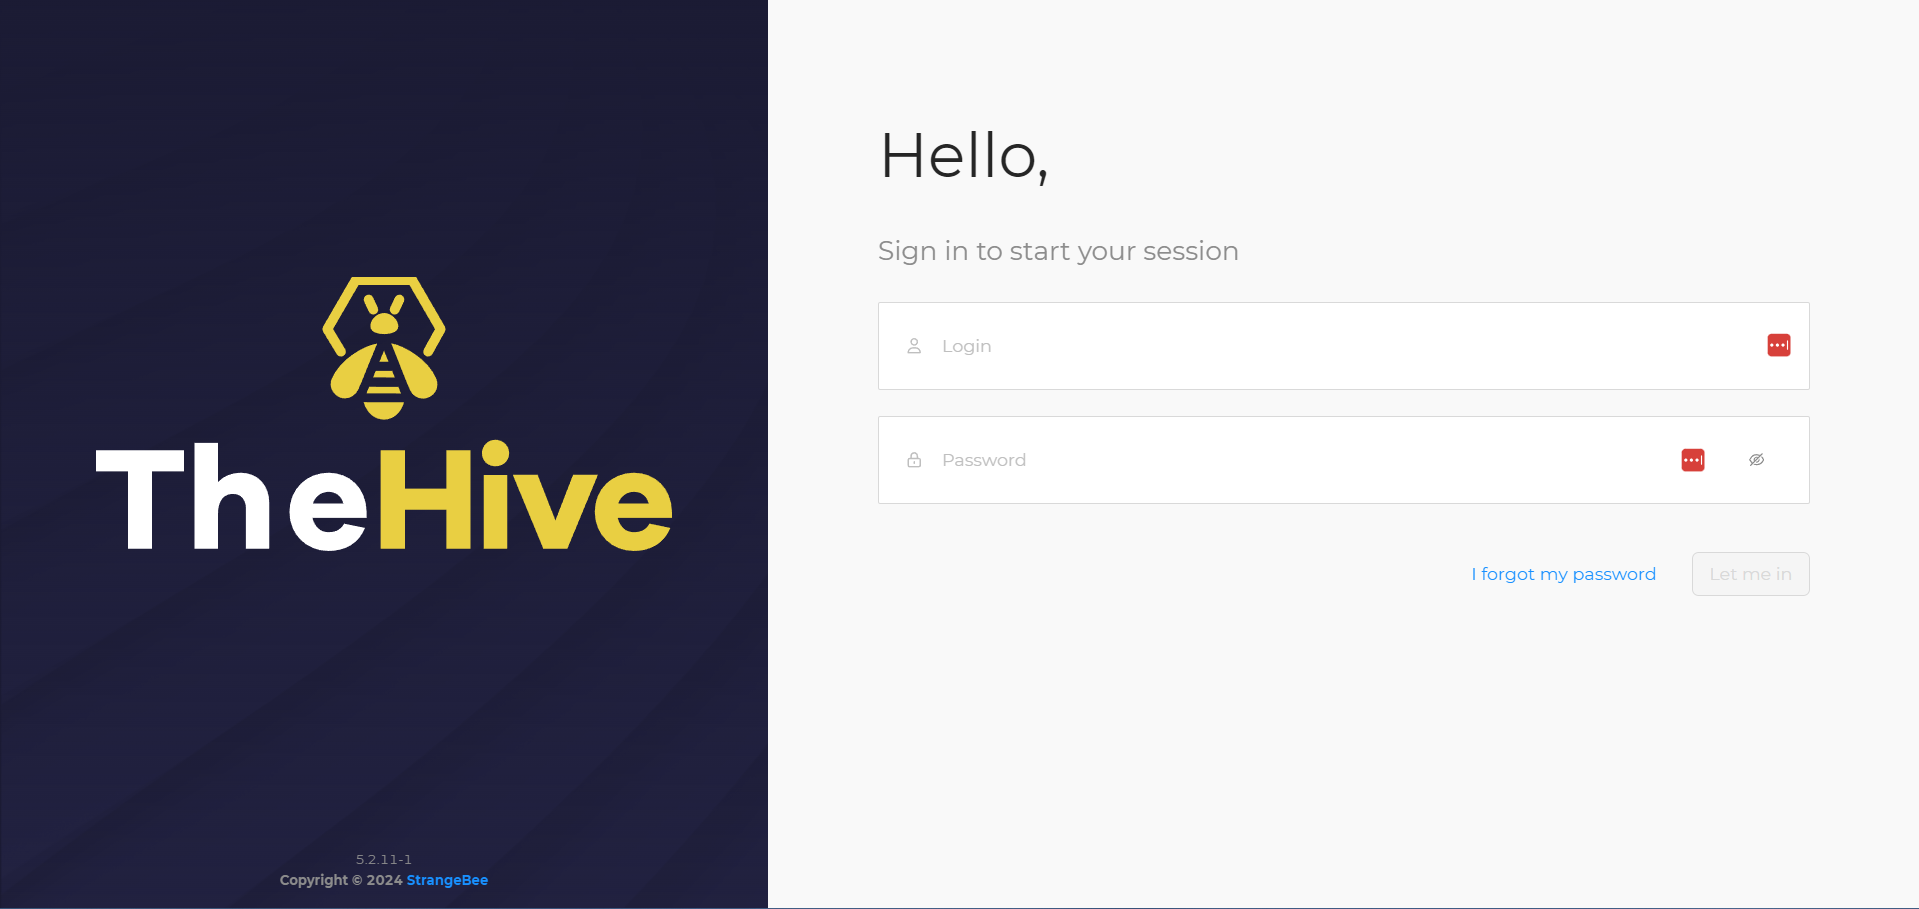
According to TheHive’s documentation, the default credentials for logging in are as follows:
Username: admin@thehive.local
Password: secret
3. Deploying a Wazuh Agent On Our Windows 10 Client
To deploy our Wazuh agent on our Windows 10 client, we can go back to our Wazuh Dashboard by entering in our Wazuh public IP into a web browser and logging in. Once logged in, we will see the following dashboard:
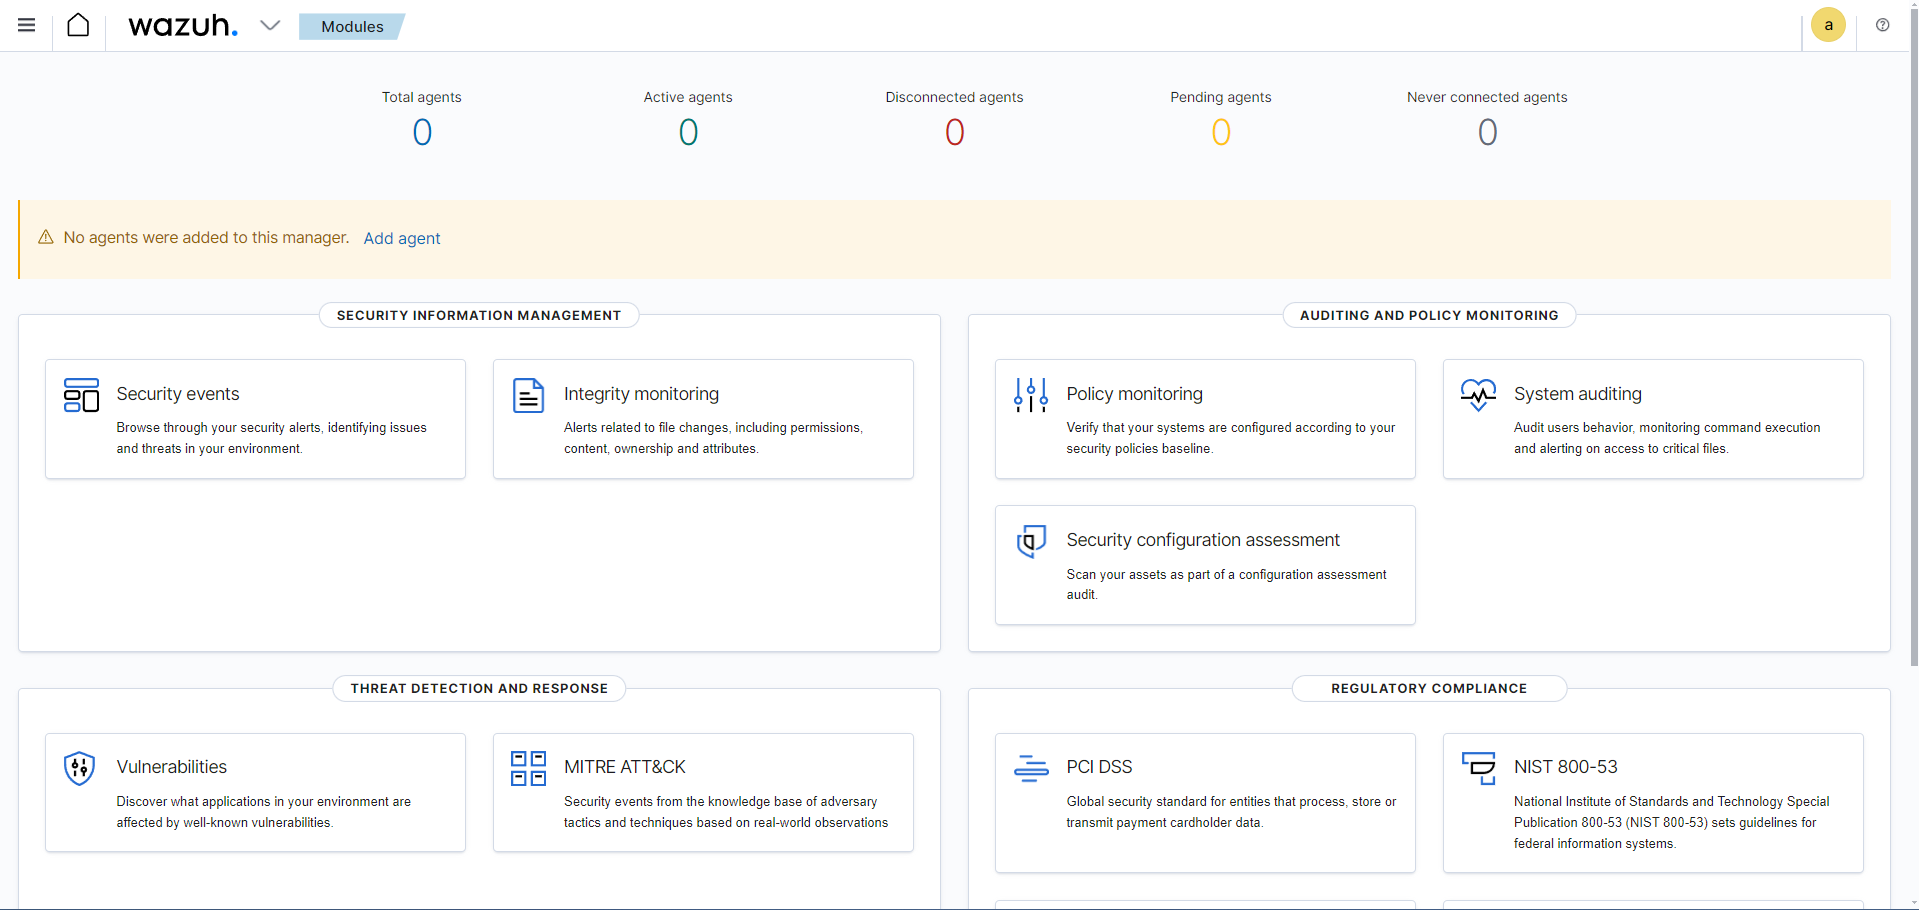
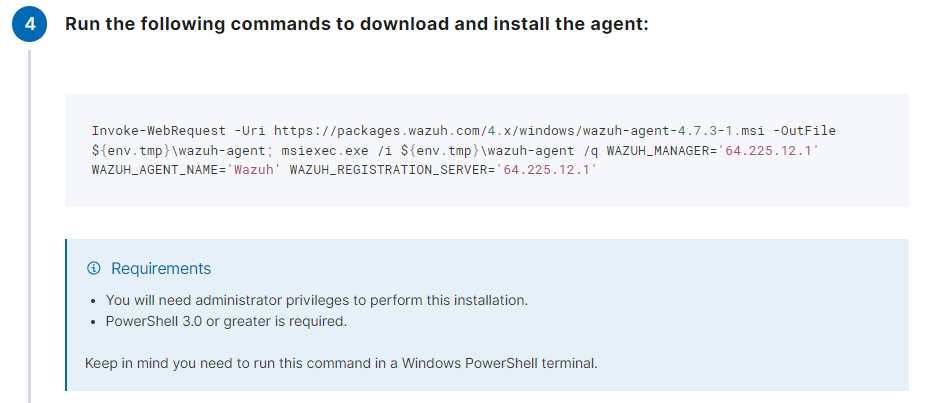
Here, you’ll notice that we have 0 total agents, as we have not connected any agents to any devices yet. If we go ahead on click on Add agent, we will get to a dashboard to begin configuring our agent. Here, you can select the OS of the device you will be adding this agent to, and the server address (our Wazuh public IP). Once the server address has been assigned, Wazuh will provide us with a command to run, along with some instructions on how to download and install the agent on our Windows 10 client machine:
Once the Wazuh agent have been downloaded and installed, we can run NET START WazuhSvc to run the Wazuh service. The Wazuh service can also be started by going to Services in Windows.
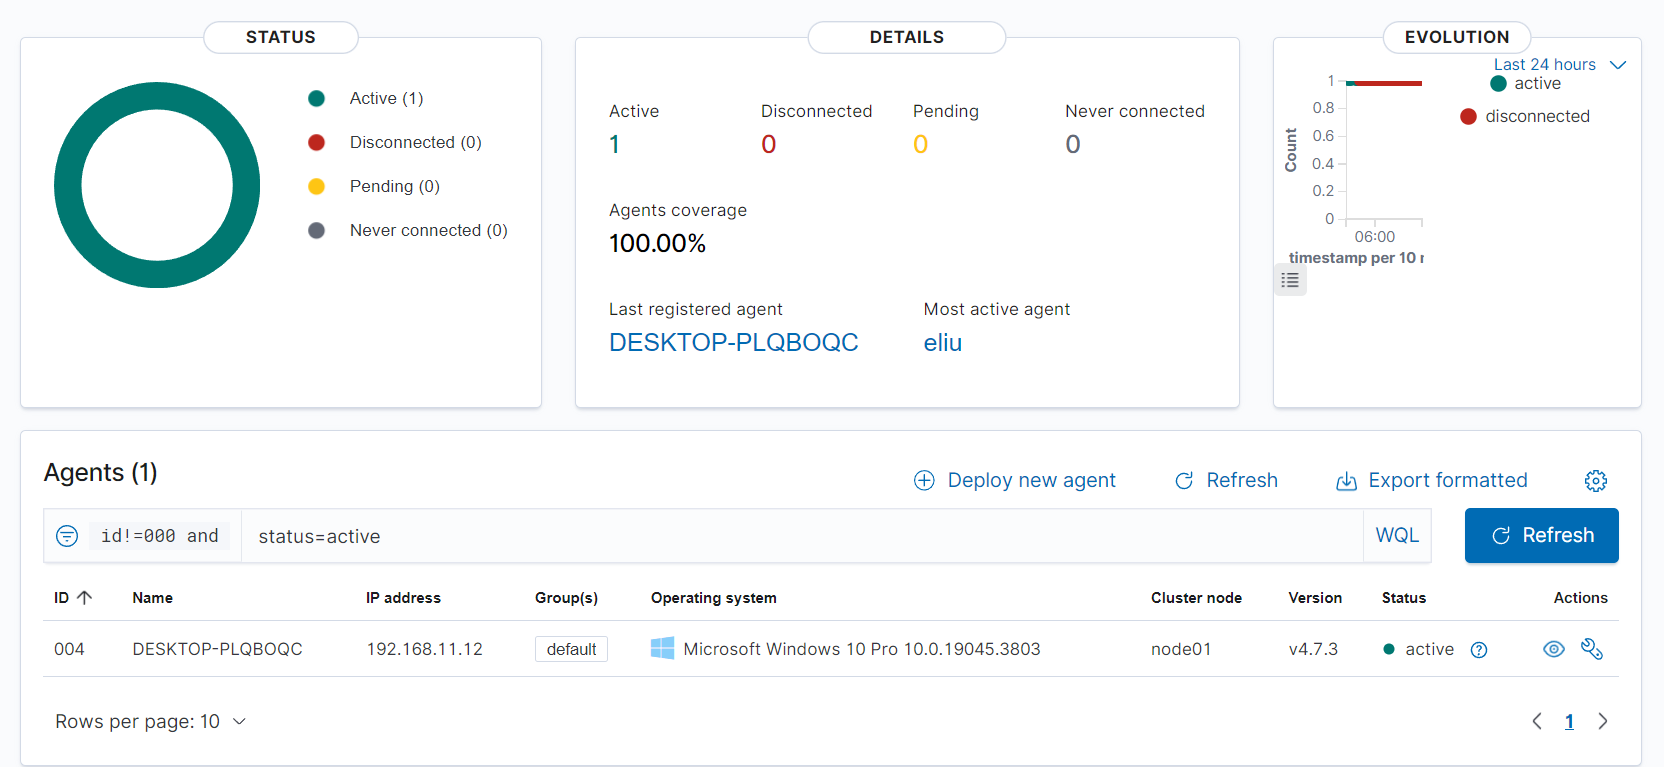
Once the Wazuh service has been started up, the Wazuh dashboard will show there being a new active agent. Digging a little deeper, we can see our Windows 10 client (DESKTOP-LPQBOQC) has been identified by Wazuh and is checking in successfully:
Now, we are able to begin querying for events!
4. Generating Telemetry and Ensuring Its Ingestion Into Wazuh
The steps to complete in this fourth part will be as follows:
4. 1. Downloading Mimikatz
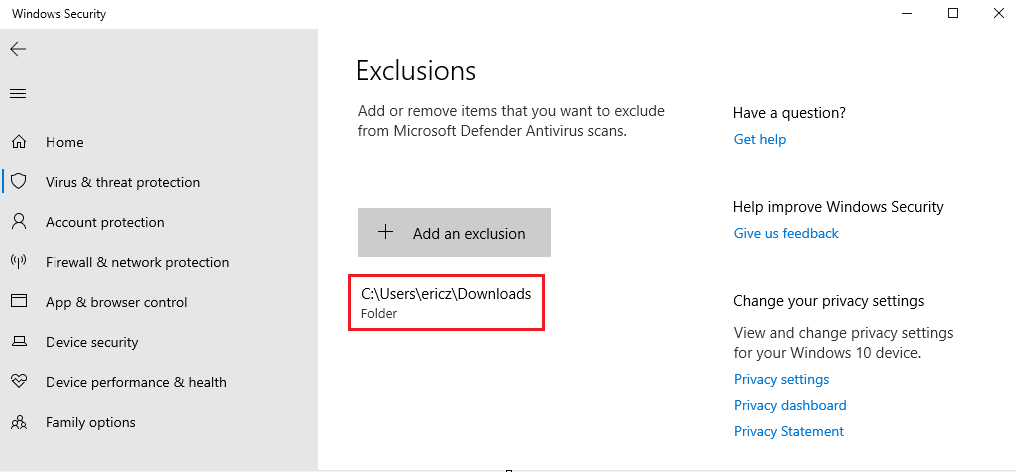
For this project, we will be downloading Mimikatz, which is a powerful post-exploitation tool that attackers and red-teamers will used to extract credentials for machines in Windows security. Because of this, Mimikatz is classified as malicious when downloaded or used inappropriately, and reputable antivirus software such as Windows Defender Antiviruswill flag it as potentially malicious due to its capabilities. To bypass this download, we can temporarily exclude the Downloads folder/path. This can be done with the following steps:
Windows Security > Virus & threat protection settings (Manage settings) > Exclusions (add or remove exclusions) > Add an exclusion > Select Downloads folder
After following these steps, you will see the Downloads file path listed as a Windows Defender Antivirus exclusion:
Once this has been done, we can begin downloading Mimikatz.
Mimikatz download: Done by downloading mimikatz_trunk.zip and saving it to our Downloads folder
Once Mimikatz has been downloaded, we can extract the zip file; from here, we want to run PowerShell in the same directory Mimikatz was downloaded, with the command \mimikatz.exe
If we search for “mimikatz” in our Wazuh dashboard, we won’t see any traffic. Why is this? This is because our Wazuh agent is currently not tracking for such behavior and will not trigger an alert. In order to begin tracking this mimikatz telemetry/behavior, we will need to modify our Wazuh ossec.conf file by creating a rule to look for specific events.
4. 2. Editing the Wazuh Conf File (ossec.conf)
After installing the Wazuh agent and installing Mimikatz, we will need to make changes to ossec.conf to begin tracking our Mimikatz telemetry. Changes to the ossec.conf file can be done with the following steps:
This PC > Local Disk (C:) > Program Files (x86) > ossec-agent > ossec.conf > Right-click > Open with notepad
Looking for processes that contain Mimikatz can be done if we have sysmon installed (which we do). Our goal is to configure the ossec.conf file to ask it to ingest our sysmon logs. Before we get started, we will create an ossec-backup file (copy of ossec.conf) first in case, in case we make any mistakes when editing this file.
Once this backup file has been created, we can navigate back to the original ossec.conf, scroll down to Log analysis, and copy the code for <localfile>:
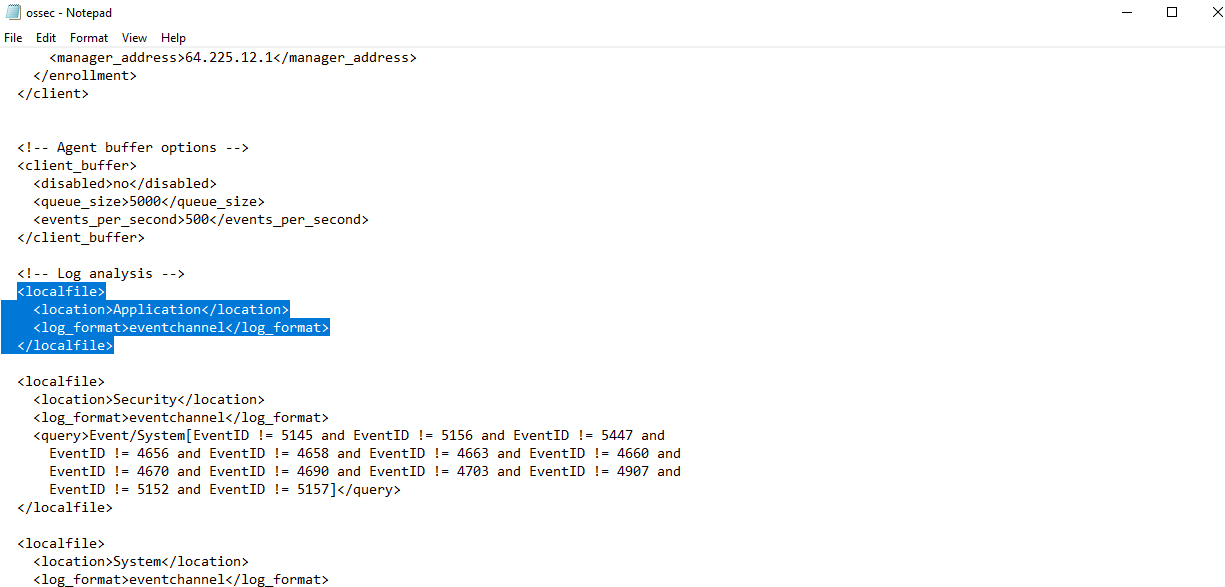
Because we are interested in ingesting sysmon logs, we want to change Application to be the channel name. The channel name can be found via Event Viewer > Applications and Services Logs > Microsoft > Windows > Sysmon > Right-clicking Operational > Properties > Full Name: Microsoft-Windows-Sysmon/Operational
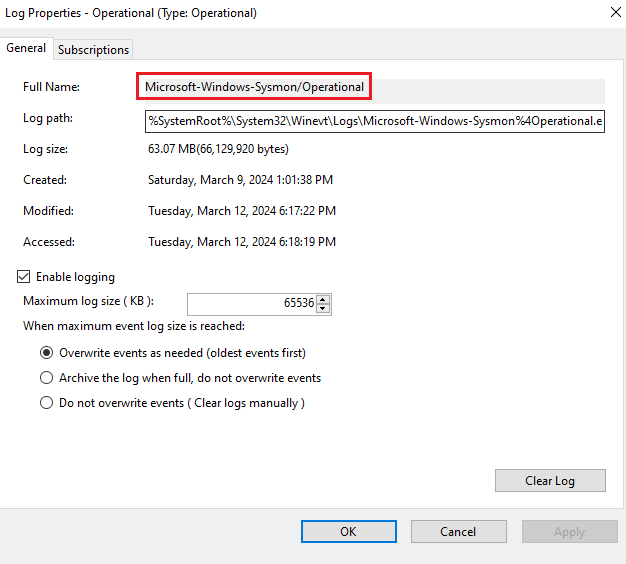
The channel name above is what will be copied and pasted into where Application exists in the copied localfile code.
For the sake of ingestion, we will also be removing the original localfile code for Application, Security, and System, location values as we do not want these to forward events to our Wazuh manager.
Once this has been done, we can save the file, and navigate to Services > Restart Wazuh service
Now, we want to go ahead and modifying the ossec.conf file on the Wazuh server itself, so that it can begin logging everything. Once logged into our Wazuh server (droplet), we will run the following commands:
Creating ossec.conf backup file in Wazuh droplet
$ cp /var/ossec/etc/ossec.conf ~/ossec-backup.conf
Editing the ossec.conf file
$ nano /var/ossec/etc/ossec.conf
Once in the ossec.conf file, we want to change the values within logall and logall_json to be yes. This will essentially set what format we want these logs to be displayed in. In this case, this will force Wazuh to begin archiving all the logs and putting it into a file called archives, which will be located in /var/ossec/logs/archive. Because we’ve edited a config file, we can restart the Wazuh service to process any changes.
Restarting Wazuh service
$ systemctl restart wazuh-manager.service
Once in the ossec.conf file, we want to change the values within logall and logall_json to be yes. This will essentially set what format we want these logs to be displayed in. In this case, this will force Wazuh to begin archiving all the logs and putting it into a file called archives, which will be located in /var/ossec/logs/archive. Because we’ve editied a config file, we can restart the Wazuh service to process any changes.
4. 3. Editing the Filebeat Log
Here, we will be editing Filebeat. Filebeat is commonly used as a “log shipper” to collect logs from various sources and forward them to the Wazuh manager. It plays a crucial role in the log collection pipeline of Wazuh, enabling efficient and centralized log management. We will be running the following commands to go about modifying the Filebeat log so that we can begin ingesting our logs:
Navigating to the "archives" files (where our logs will be placed)
$ cd var/ossec/logs/archives
Adjusting Filebeat config file (filebeat.yml)
$ nano /etc/filebeat/filebeat.yml
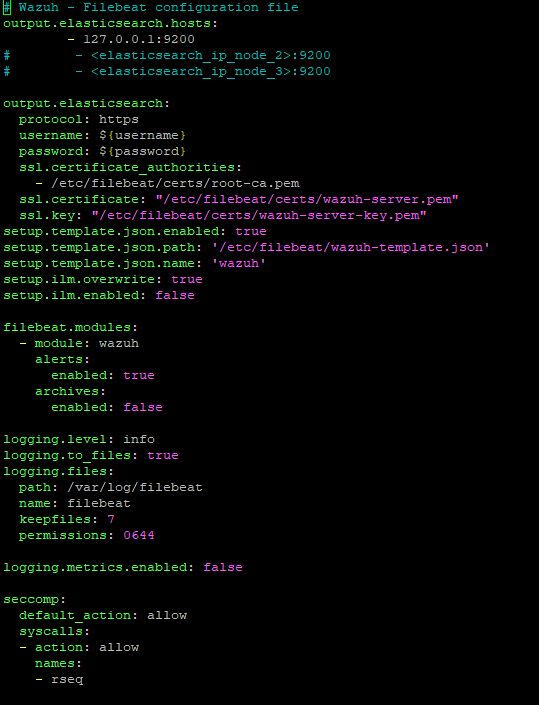
All we need to do here is change the archives value under filebeat.modules to be true. Once this has been done, we can save/close the config file, and restart filebeat.service for the changes to update.
With ossec.conf and filebeat.yml configured, we are ready to begin ingesting logs!
4. 4. Creating a New Index in Wazuh Dashboard
Our goal now is to create an index pattern for archives to be able to search for our logs, regardless of whether Wazuh has triggered an alert. Once logged back into our Wazuh dashboard, we will do this with the following steps:
Clicking on the Hamburger icon > Stack management > Index patterns > Create index pattern
We will name the index pattern as wazuh-archives-**:
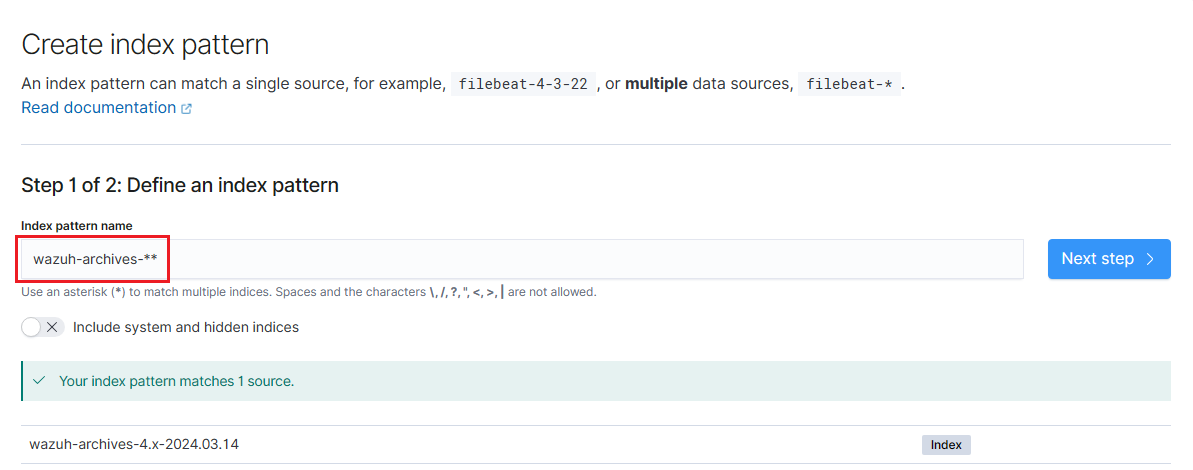
On the next page, we will set timefield: timestamp to indicate that that we are designating a particular field within the index to be the timestamp field, allowing our security events to be timestamped and provide events based on time.
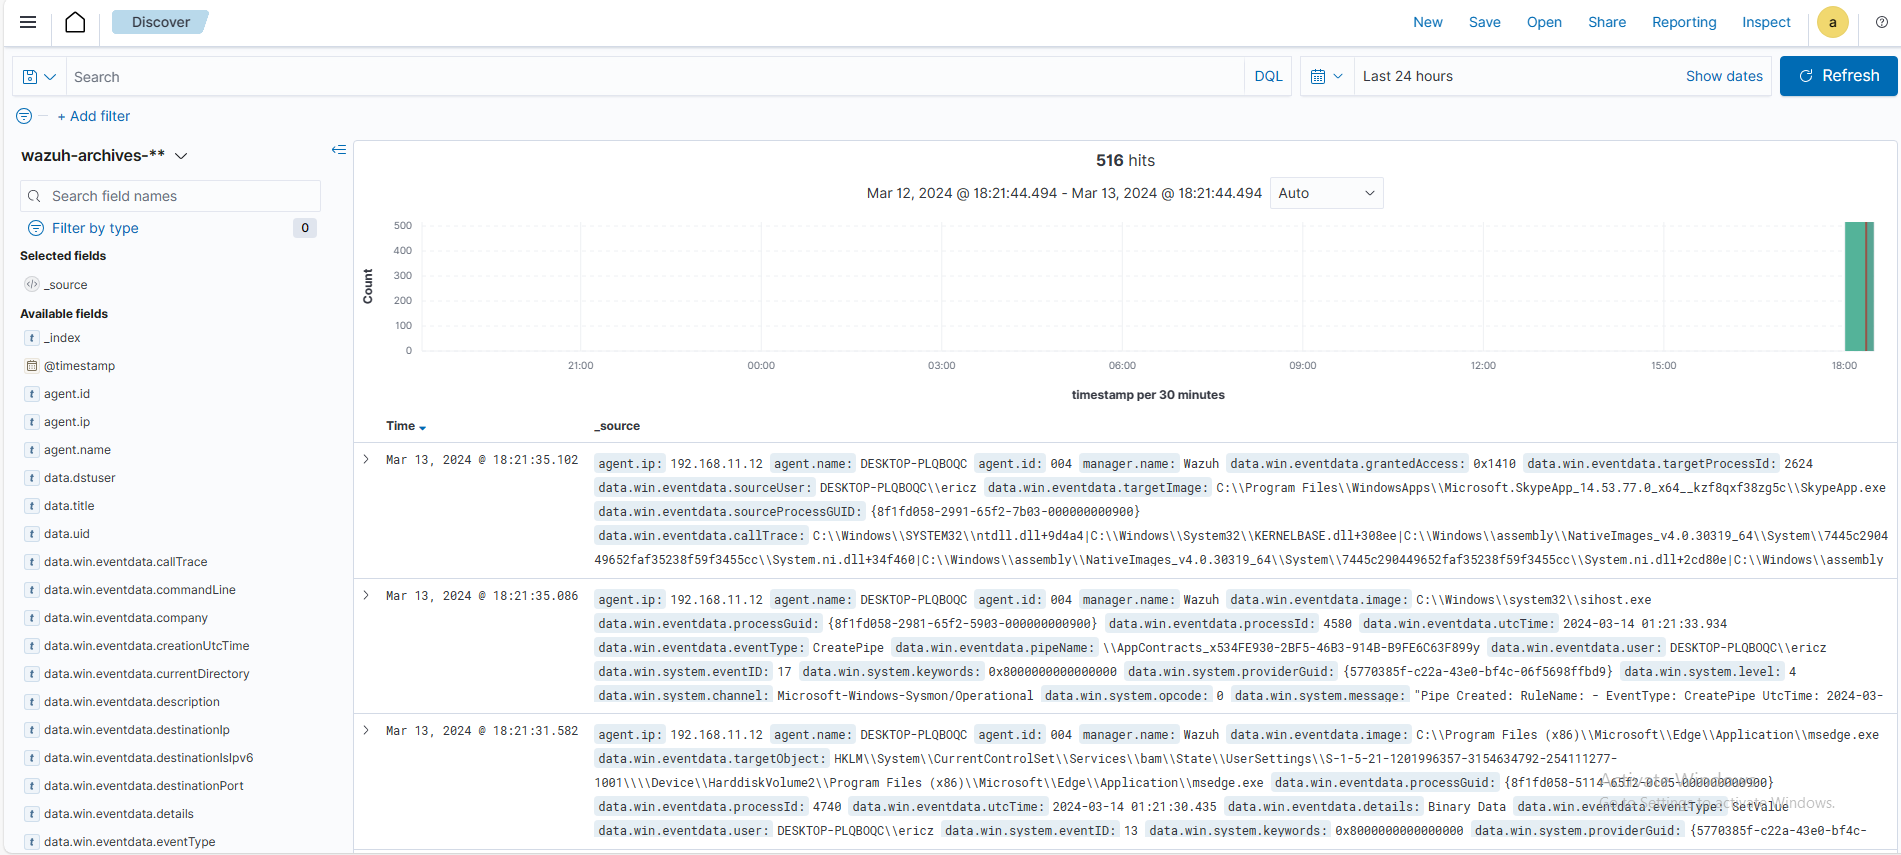
Once created, we can navigate to our newly created index pattern with the following steps:
Clicking on the Hamburger icon > Discover > wazuh-alerts-* > Select your new index pattern
4. 4. Checking/Troubleshooting for Mimikatz Events
With our Wazuh index created, we can now begin troubleshooting to see if a mimikatz event was generated in our logs. Let’s log into our Wazuh server and run the following command:
Displaying lines from archives.json that contain "mimikatz", regardless of letter case
$ cat archives.json | grep -i mimikatz
If we run this command and see nothing, then a Mimikatz event did not generate. As a result, we also will not see any mimikatz events in our Wazuh dashboard. We can re-run Mimikatz from PowerShell with .\mimikatz.exe, and then navigate to Windows Event Viewer > Applications and Services Logs > Microsoft > Windows > Sysmon > Operational to identify whether or not sysmon is capturing our newly-run Mimikatz event.
Here, we are looking for any recent events with Event ID = 1, as this event ID indicates new process creations. We can see that the following event is the mimikatz.exe Process Create event:
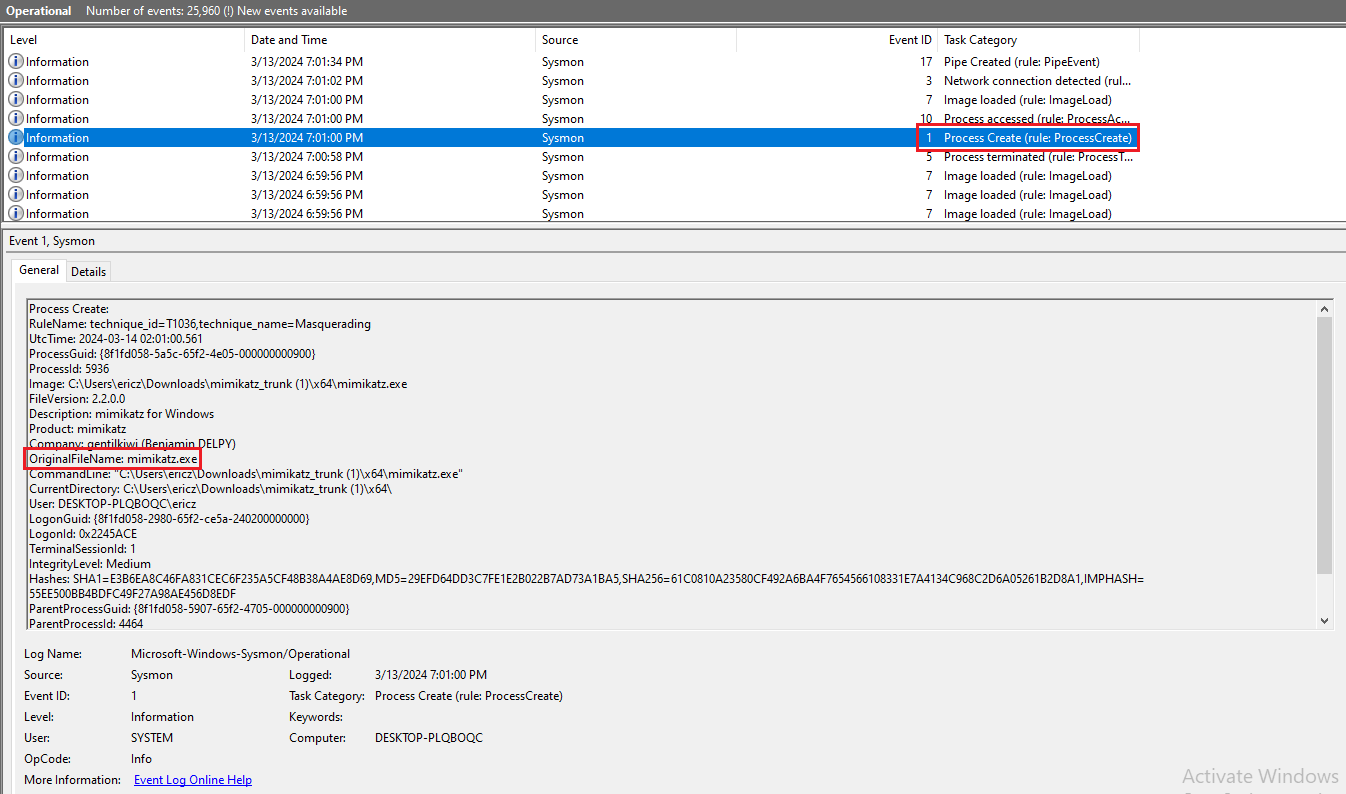
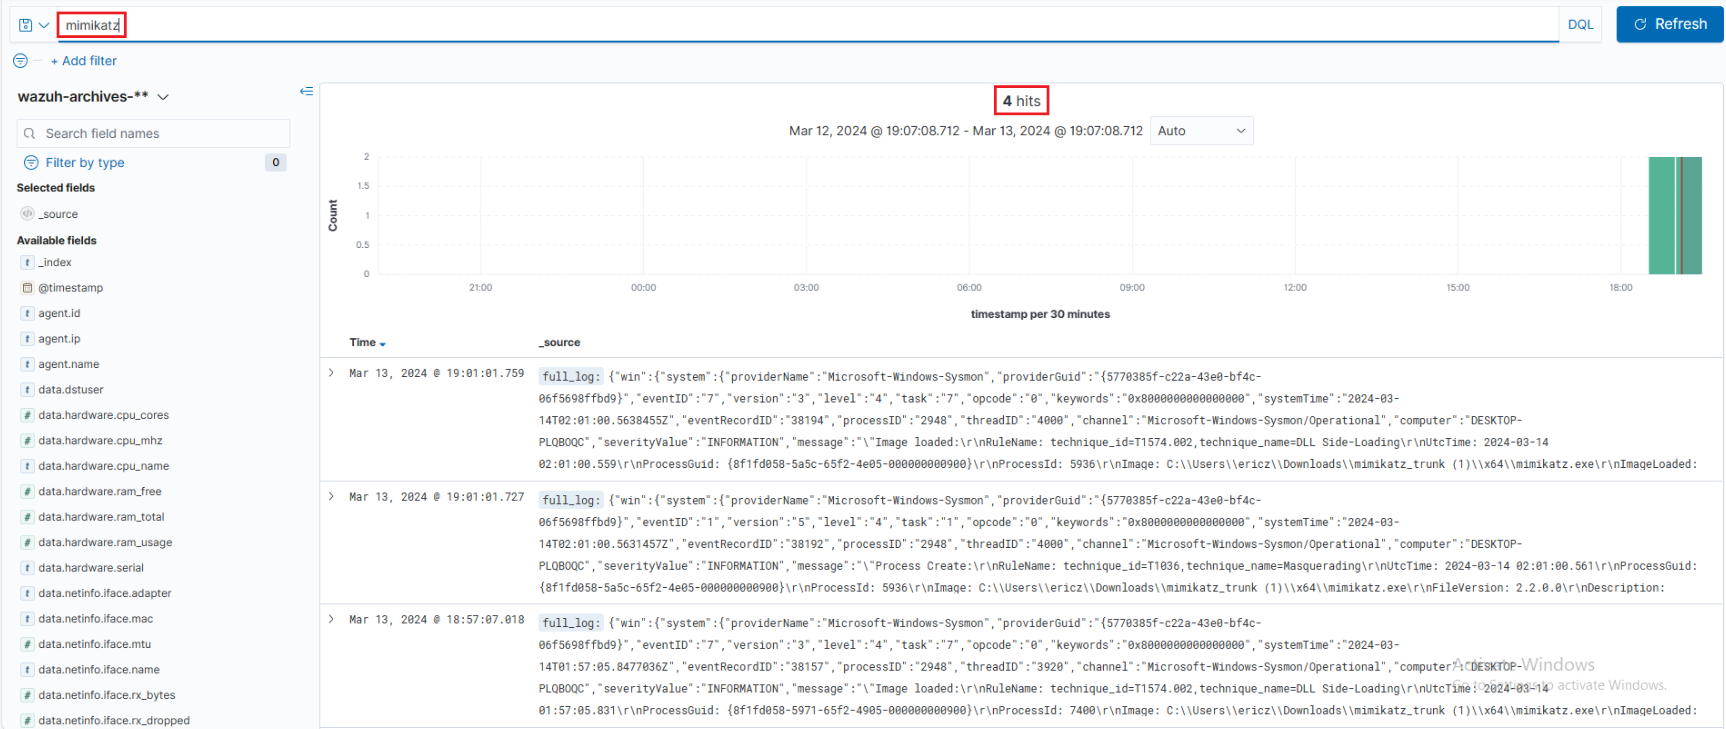
If we run cat archives.json | grep -i mimikatz once again on our Wazuh server, we will see Mimikatz log info this time in our archives.json file. If we log into our Wazuh dashboard now, we will see four events when searching for Mimikatz:
4. 5. Creating/Triggering a Custom Mimikatz Alert on Wazuh
With our sysmon events being logged into Wazuh, we can now go ahead and create our Mimikatz Wazuh alert.
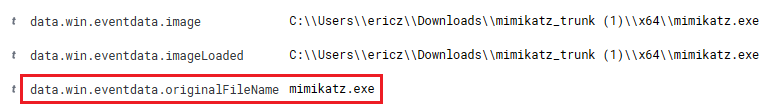
If we expand the event for any of the four Mimikatz events from the Wazuh dashboard above, we will see a field called data.win.eventdata.originalFileName. We will be using this field to create our alert:
By default, Wazuh has some built-in rules that we can find through the Wazuh dashboard itself by navigating through Wazuh manager dropdown > Management > Rules > Manage rules files
Since we are interested in sysmon rule ID = 1, we can try and find that by typing sysmon and hitting enter:
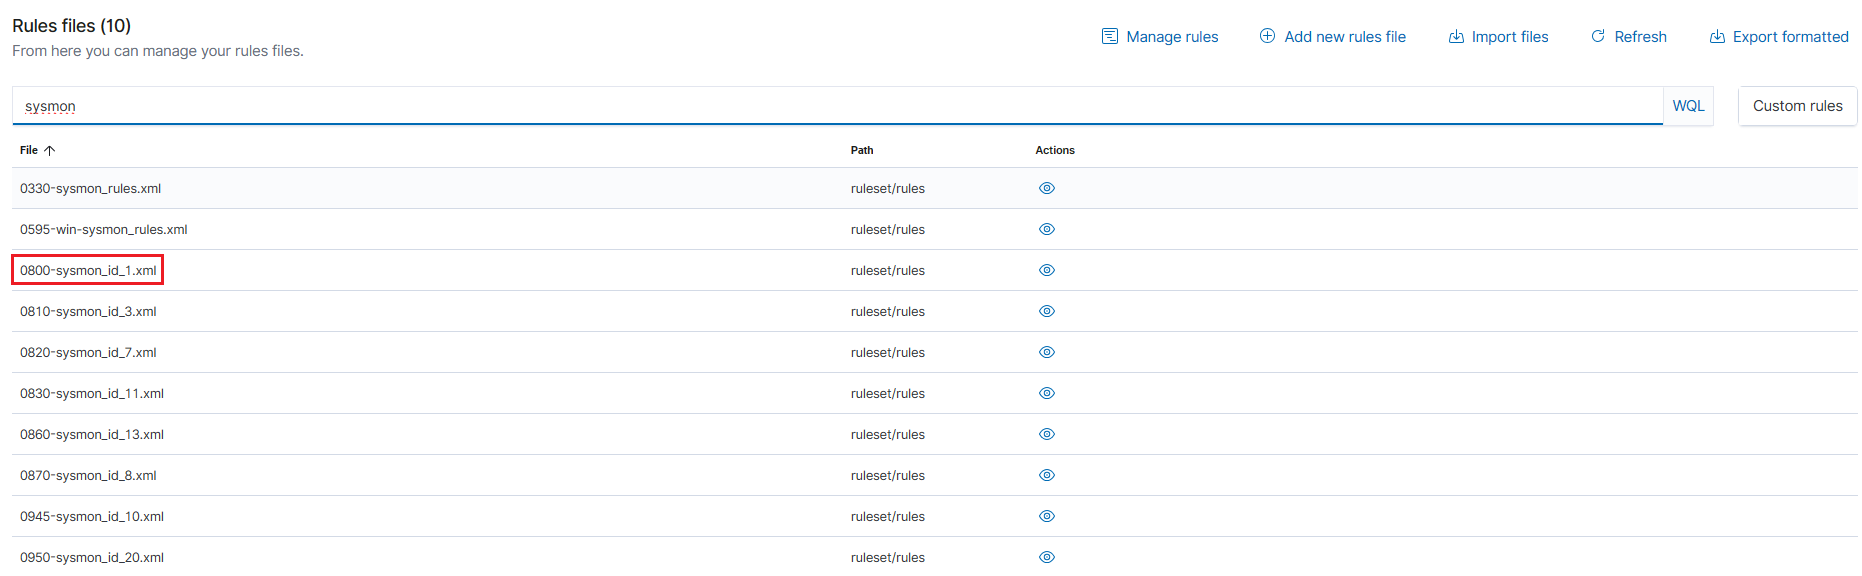
Here, we can find 0800-sysmon_id_1, which is the process creation rule we previously found through Windows Event Viewer. We can take a closer look at this rules file by clicking on the actions (eye) icon to the right. This page is essentially the sysmon rules that are built into Wazuh, specifically targeting this event (ID 1).
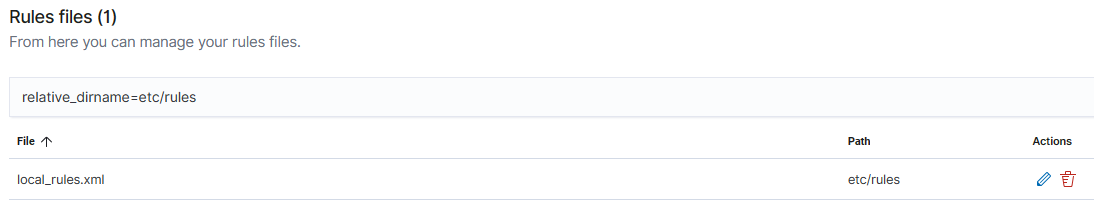
We will be copying one of these rules files as a reference to build our custom rule for Mimikatz. To create the custom rule, we will go back to the Rules files page and click on Custom rules. From here, we will see a single local_rules.xml file. This is the rule we will be editing – let’s click on the edit (pencil) button to edit this rule file:
From here, we want to paste in the following rule we copied from the 0800-sysmon_id_1 rule file:
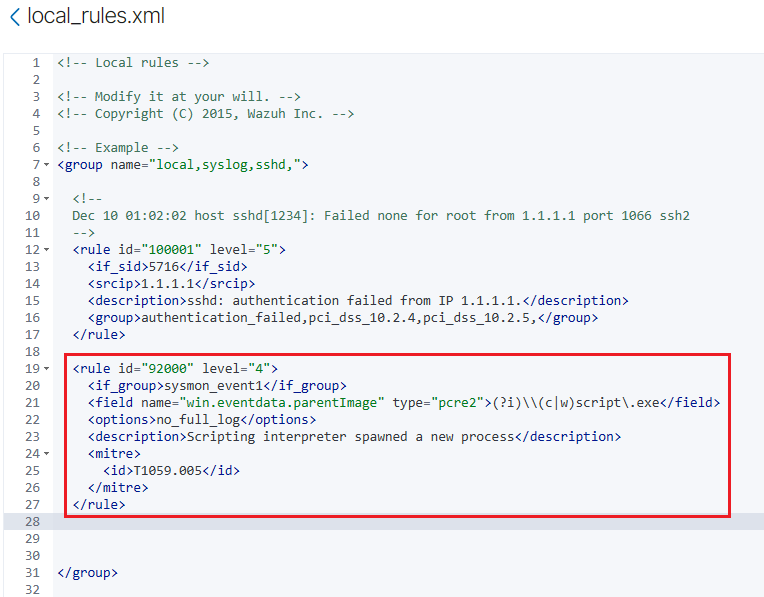
Our job now is to customize our rule above. It’s important to note the following when customizing our rule:
1. We will be setting our rule id to be 100002, as the previous rule is at 100001.
2. level refers to the severity of the alert, with higher numbers indicating higher importance. 15 is the highest level; for testing purposes, we can simply have it set to that value.
3. The field name will be changed to be win.eventdata.originalFileName, as this will be the unique, unchangeable field used for reporting, as discussed previously.
4. We want to replace \\(c|w)script.exe with mimikatz.exe, this way our rule is searching specifically for Mimikatz in the originalFileName.
5. We will remove <options>no_full_log</options> as we want all of the logs.
6. The description tag can be changed to something more relevant, such as Mimikatz Usage Detected
7. The id tag within the mitre tag will be replaced to be T1003, as this tag ID is used to classify credential dumping (which Mimikatz is known to do). This tag is not necessary, however, it will add valuable context when viewing the alert, with the information integrating well with other security tools.
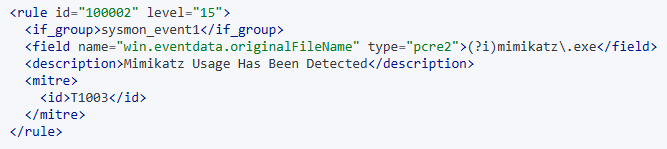
Once we have made all the needed changes, our customized rule will look like the following:
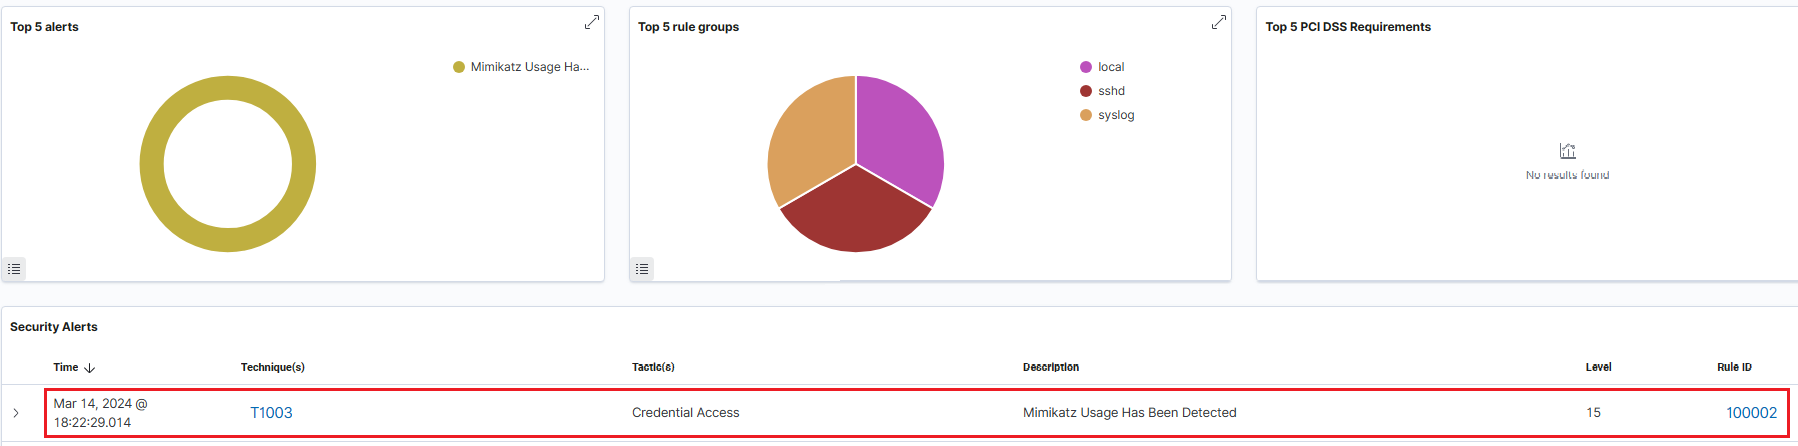
We can save and close this local_rules.xml file, and go about testing our newly created Wazuh alert. Within the Wazuh dashboard, we’ll head over to Home > Security Events > Type “mimikatz” into the search bar > Hit enter. We should see no existing alerts. Let’s go back to our file/folder directory where we installed Mimikatz, rename mimikatz.exe to thisisnotmimikatz.exe (to test our originalFileName field), and run it in PowerShell.
Finally, we can now go ahead and checked our Wazuh dashboard – here, we see that our Mimikatz alert has been flagged, despite being re-named to something different!
5. Shuffle Setup and Creating an Automated Workflow
The steps to complete in this fifth (and final) part will be as follows:
- Connecting Wazuh to Shuffle
- Implementing Regex to Extract SHA256 File Hash
- Connecting VirusTotal’s API to Analyze Hash Value
- Connecting TheHive to Shuffle
- Connecting Email to Shuffle
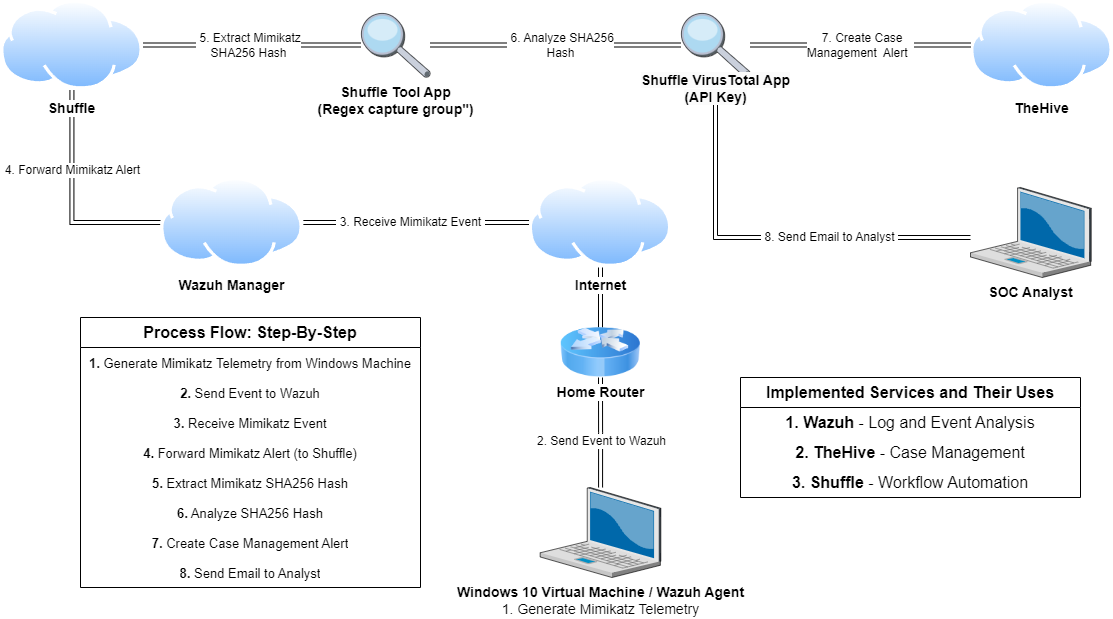
1. Our triggered Mimikatz alert will be sent from Wazuh to Shuffle through a webhook
2. Shuffle will receive our Mimikatz alert, and will use regex pattern to extract the SHA256 hash from the file
3. The SHA256 hash will be sent to VirusTotal, checking the hash’s reputation score
4. Details above will be sent directly to TheHive to create an alert/ticket
5. An email will be sent to an end-user to assist them in beginning the investigation
The first step towards setting up Shuffle starts with creating an account and creating a new workflow. Once logged into shuffler.io, we can navigate to to Workflows page and click on New Workflow. Once we name this workflow, we will arrive at our workflow dashboard, where we can begin adding apps, triggers, and creating our automated workflow.
We’ll start off by selecting/configuring a webhook and copying its URI with the following steps:
Triggers > Webhook > Drag and drop onto screen > Left-clicking webhook icon > Changing the name > Copying the Webook URI
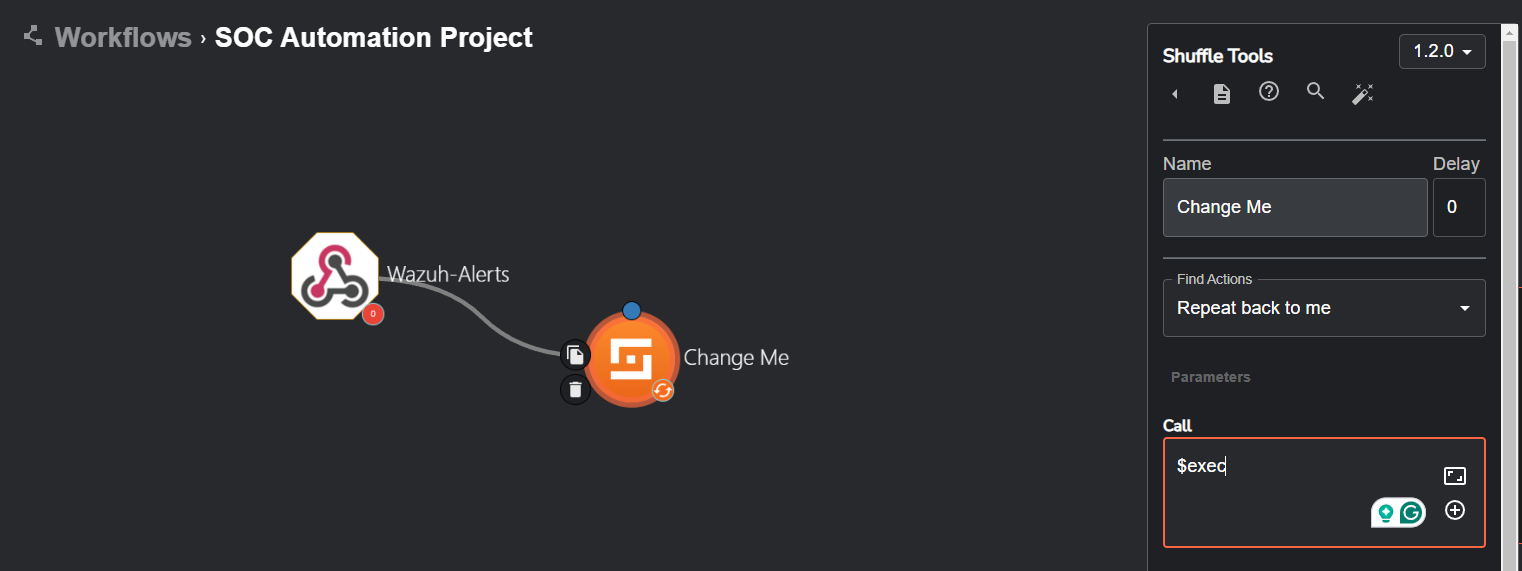
We also want to add an execution argument to the Change Me icon with the following steps:
Left-clicking Change Me > Adding In Execution Argument ($exec)
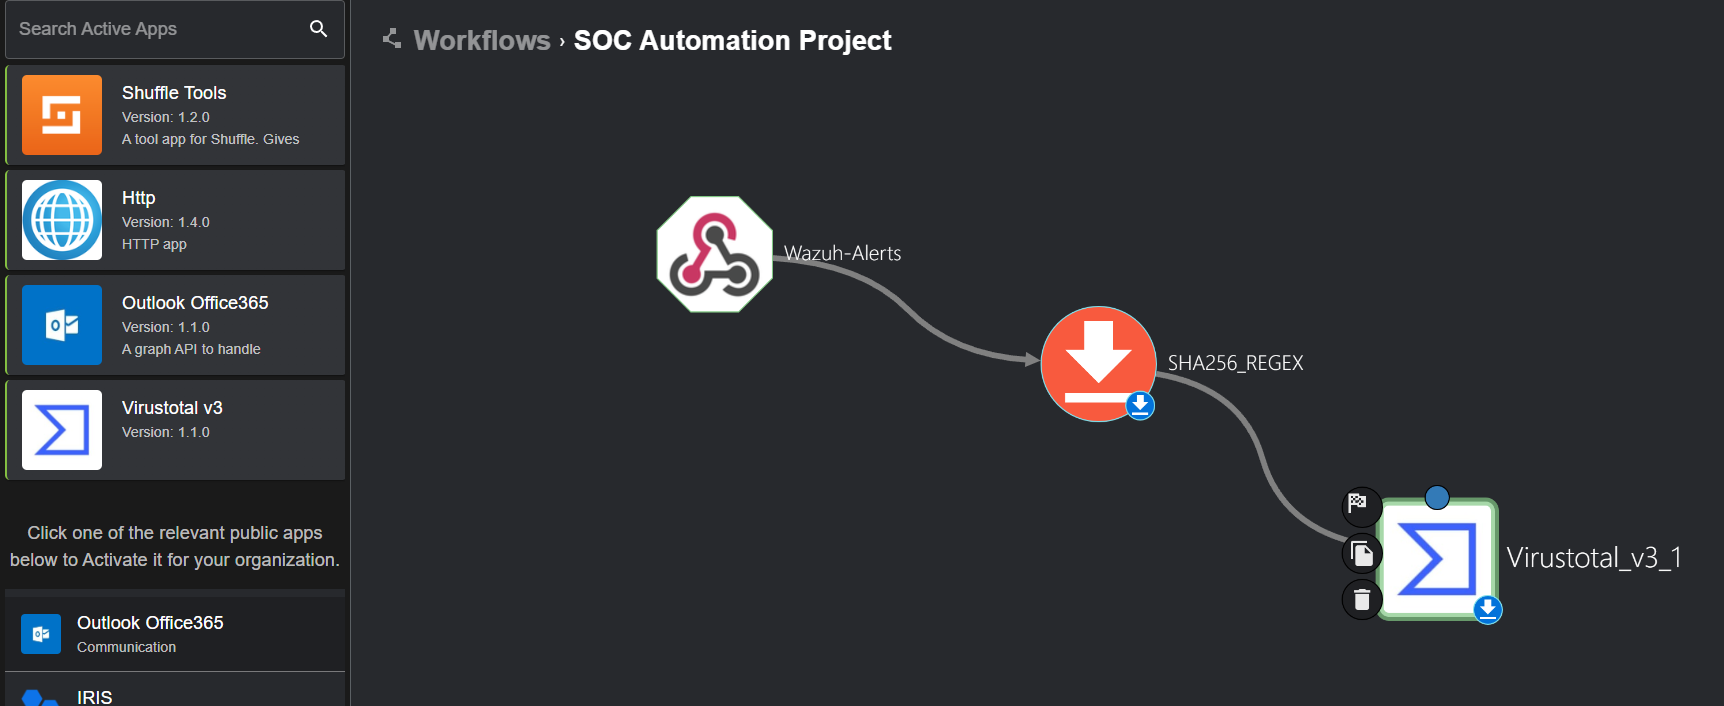
After we connect our Wazuh-Alerts webhook to our “Change Me” utility app (which provides a multitude of different actions), our workflow should now look like the following:
5. 1. Connecting Wazuh to Shuffle
To connect Wazuh to this Shuffle workflow, we will SSH back into our Wazuh server and add something called an integration tag into the ossec.conf file.
Editing the ossec.conf file
$ nano /var/ossec/etc/ossec.conf
Once we are in the ossec.conf file, we will be pasting the following code to allow Wazuh and Shuffle to send and receive information to one another through the webhook:
<integration>
<name>shuffle</name>
<hook_url>http://<YOUR_SHUFFLE_URL>/api/v1/hooks/<HOOK_ID></hook_url>
<rule_id>100002</rule_id>
<alert_format>json</alert_format>
</integration>
We are going to replace http://<YOUR_SHUFFLE_URL with the webbook UI we previously copied. It does not matter where we place this code within the ossec.conf file; as long as it is within the file, we are good to go.
As always, we can restart the Wazuh instance to update the changes to our configuration file.
Restarting/Checking Status of Wazuh service
$ systemctl restart wazuh-manager.service
$ systemctl status wazuh-manager.service
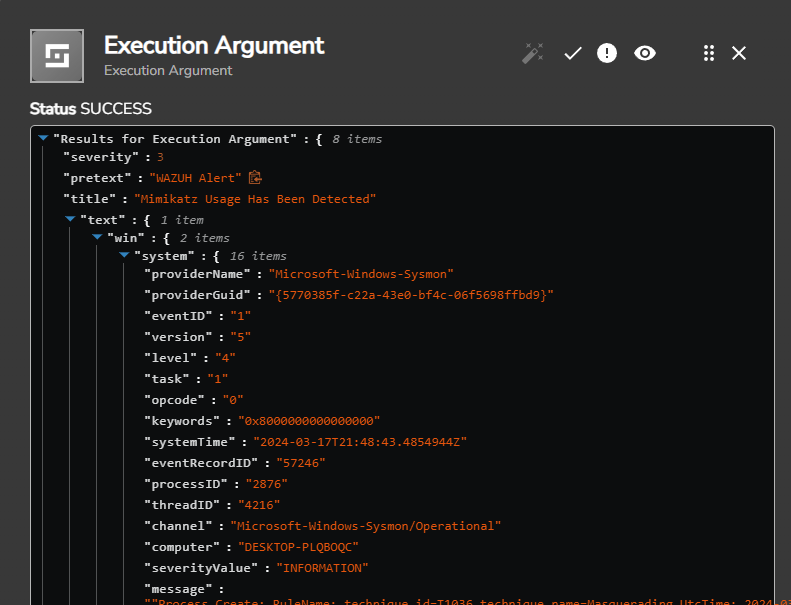
To test our webhook, we will be re-generating our Mimikatz telemetry on our Windows 10 machine and clicking on the Show executions button (running person icon) at the bottom of the workflow dashboard to show us all the workflow executions that were run – from here, we can see that our webhook was executed.
If we click on the details for the Execution Argument, we are able to see that it has retrieved all the information generated from our Wazuh alert itself!
5. 2. Implementing Regex to Extract SHA256 File Hash
If we scroll down the Execution Argument from above, we’ll get to a “hashes” field:
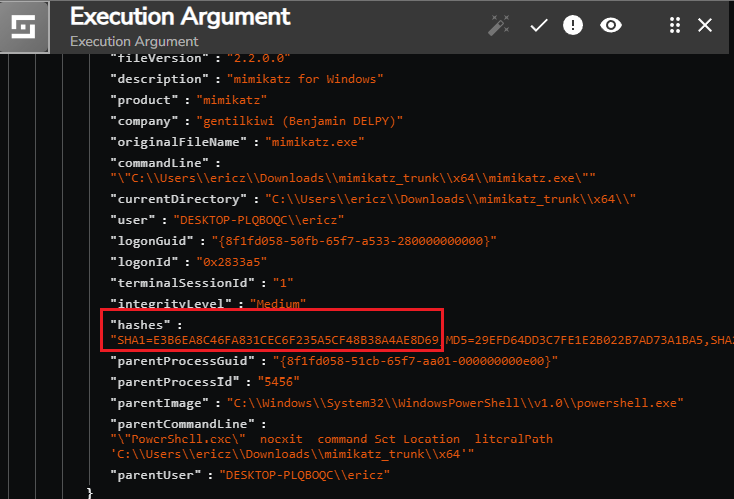
In the example above, we see the return values having the hash type prepended to the hash. For instance, we see SHA1=E3B6EA8C46FA831CEC6F235A5CF48B38A4AE8D69,MD5=29EFD64DD3C7FE1E2B022B7AD73A1BA5
For the sake of automating this with VirusTotal, we only want the hash itself, and need to parse the SHA1= text out of the value. This can be done by editing the Change Me trigger by changing its action so we can implement some regex code. We can use ChatGPT to help us create a regex pattern:
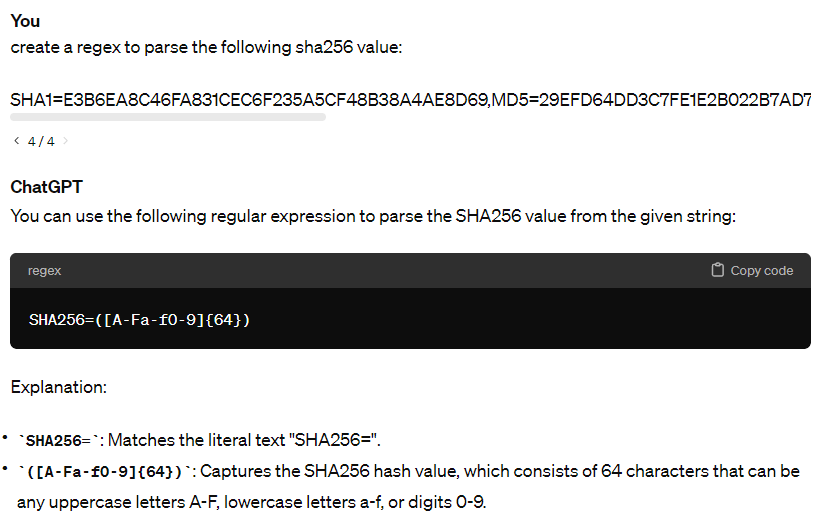
We can paste this regex code into the Regex field in the trigger, and then save/re-run the workflow to view the results:
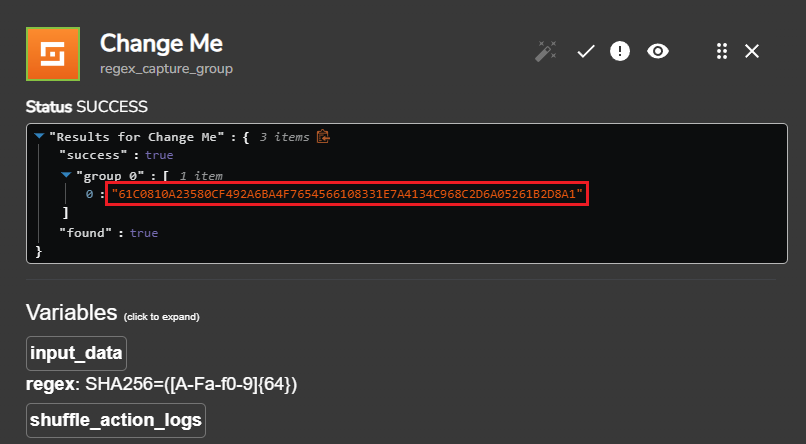
Here, we can see that the hash value has been parsed out! With this, we are now ready to have this captured hash value information automatially sent over to VirusTotal to check its reputation score.
5. 3. Connecting VirusTotal's API to Analyze Hash Value
To add VirusTotal into this automated workflow, we first need to sign up for a VirusTotal account. Once signed in, we can navigate to the top right of the website, click on the dropdown, and select API key. This page provide us with our VirusTotal API key, which we can copy and use for later. We can head back to our Shuffle and search/add the VirusTotal app to our workflow:
We can now click on the VirusTotal icon and click Authenticate Virustotal V3. Afterwards, we will be able to enter in our API key from before. We will also want the Hash field to point to the regex output ($sha256_regex.group_0.#).
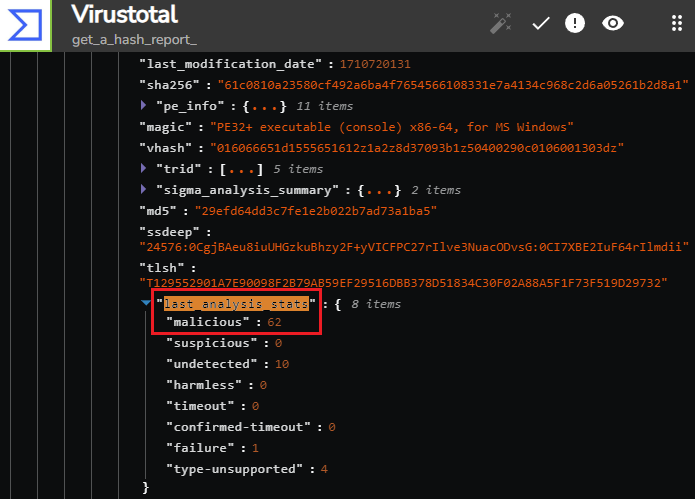
Now, if we re-run the workflow, we will receive a response from VirusTotal of status code respone of 200, indicated success (as shown from VirusTotal’s API documentation). If we open up the response through body > data > attributes and scroll don to the last_analysis_stats field, we can see that there is a malicious value of 62. This means that 62 scanners have identified the file hash as malicious:
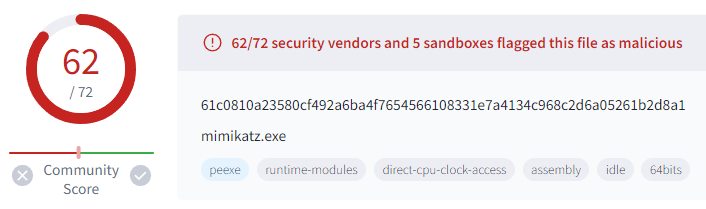
We can double-check the legitimacy of this data by copying the hash value from this output and inputting it into VirusTotal at virustotal.com. Sure enough, we will see that the numbers match:
5. 4. Connecting TheHive to Shuffle
With both Wazuh and VirusTotal connected to Shuffle to gather info on the analyzed hash, our goal is to now automatically forward the gathered details/information to TheHive to create an alert/ticket.
Once we log back into our TheHive dashboard, we will be doing the following actions to get things set up for Shuffle:
1. Creating a new organizaton
2. Creating/adding two users in that organization (User 1: Normal Account), (User 2: Service Account) and setting their passwords
3. Creating an API key by clicking on the created user/profile and saving the key
4. Logging out of TheHive and logging in with our user account
Once these steps have been done, we are ready to have TheHive implemented into our Shuffle workflow. We can go ahead and drag TheHive app into our workflow, and connect it to VirusTotal in the workflow. Similar to VirusTotal, we want to click on the TheHive icon, and click Authenticate TheHive 5. From here, we will be able to enter in our API key on the left. We also want to enter in the public IP of our TheHive server in the url field, and will also want to change the app’s action to be Get alert:
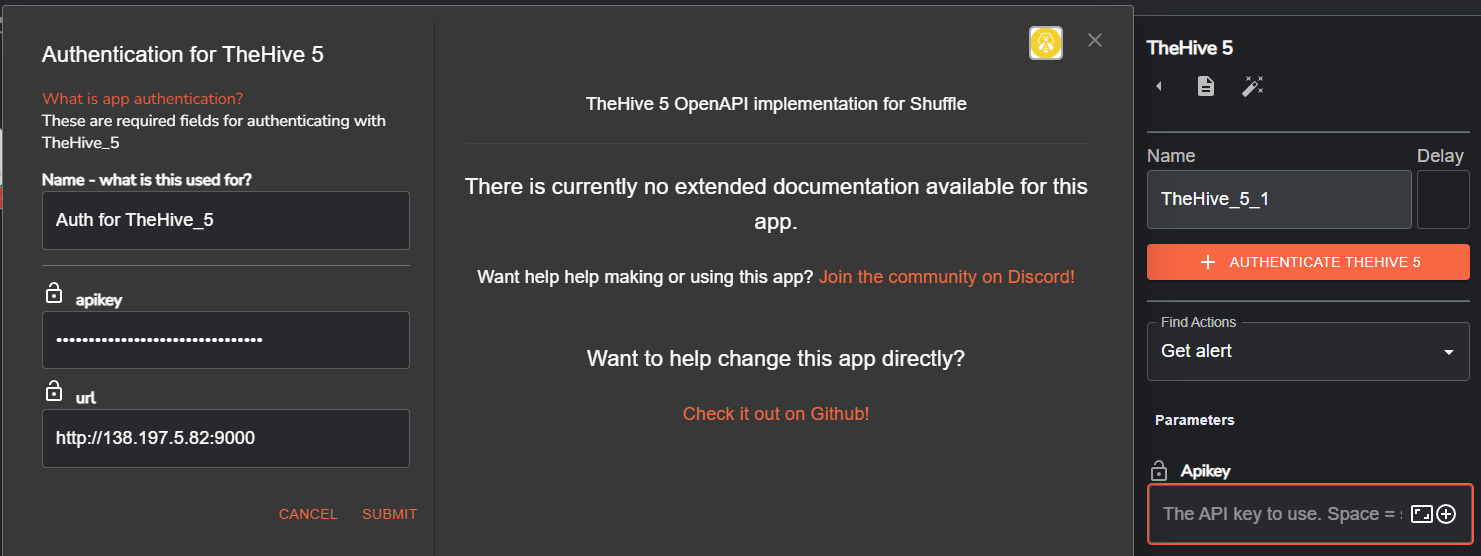
Here, we will notice many parameters/fields within the TheHive’s Shuffle app. We will be changing the following parameters within the app’s body:
Date = utcTime
Description = “Mimikatz Detection on host: $exec.text.win.system.computer from user$exec.text.win.eventdata.user”
Summary = “Mimikatz activity detected on $exec.text.win.system.computer and the process ID is: $exec.text.win.system.processID and the Command Line is $exec.text.win.eventdata.commandLine”
Pap = 2
Severity = 2
Source = Wazuh
Sourceref = “Rule: 100002”
Status = New
Flag = False
Tags = [“T1002”]
Tlp = 2
Type = Internal
Title = $exec.title (tying it to the alert itself)
The final thing we need to do now is to add a new inbound rule for TheHive on our firewall so it is able to communicate. This rule will simply be stating the following: Allow ALL IPv4 TCP Traffic on Port 9000
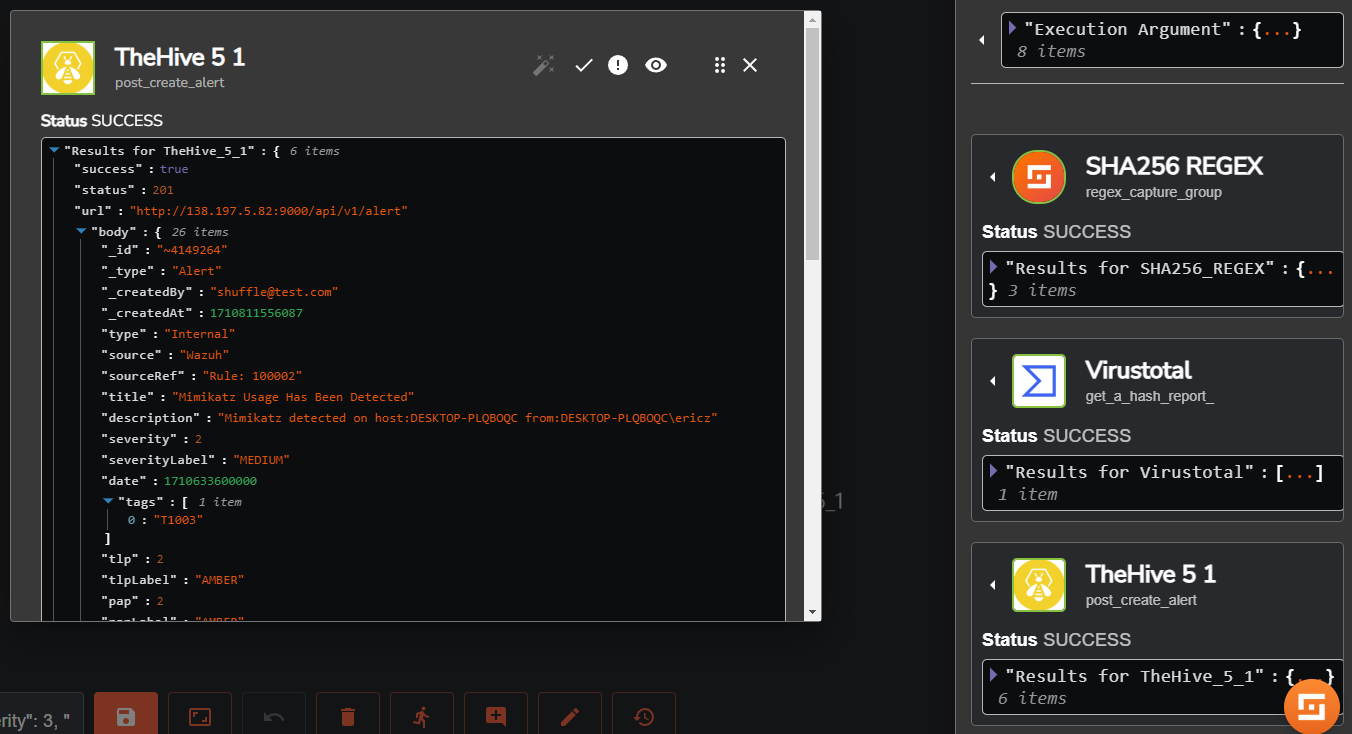
With this completed, if we go ahead and re-run our Shuffle workflow, a successful output will provide us with the following information that we just set:
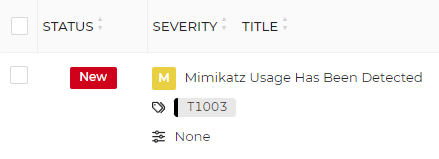
Logging into our TheHive Dashboard, we will see that a new alert has been created with the information we filled out:
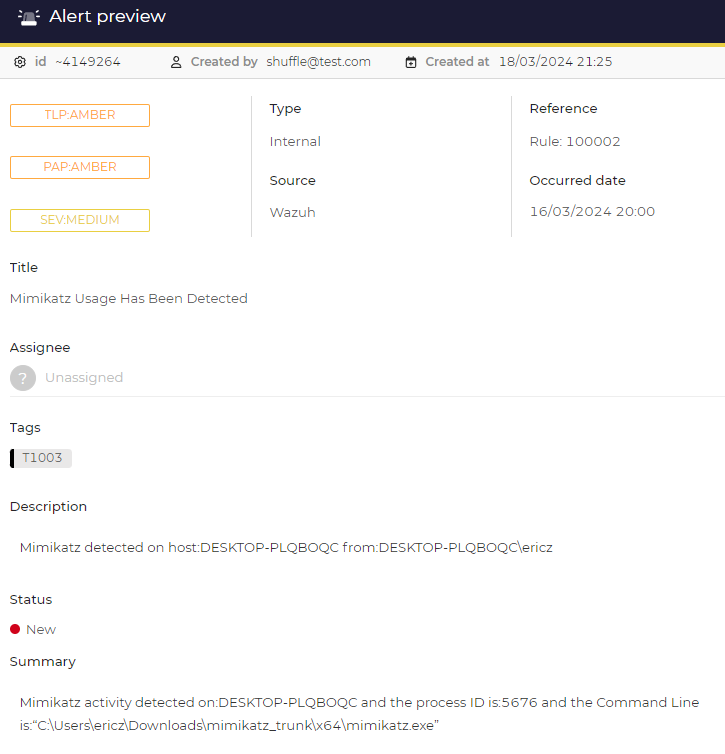
And if we click on the alert to view more of its details in the Alert preview, we will see the details of the information we previously filled out!
5. 5. Connecting Email to Shuffle
The last thing to add to this workflow is an email app so that we can automatically send an email to our (hypothetical) SOC analyst to inform them about our Mimikatz alert that has occurred. We can simply do this by adding the Email app to our workflow as follows:
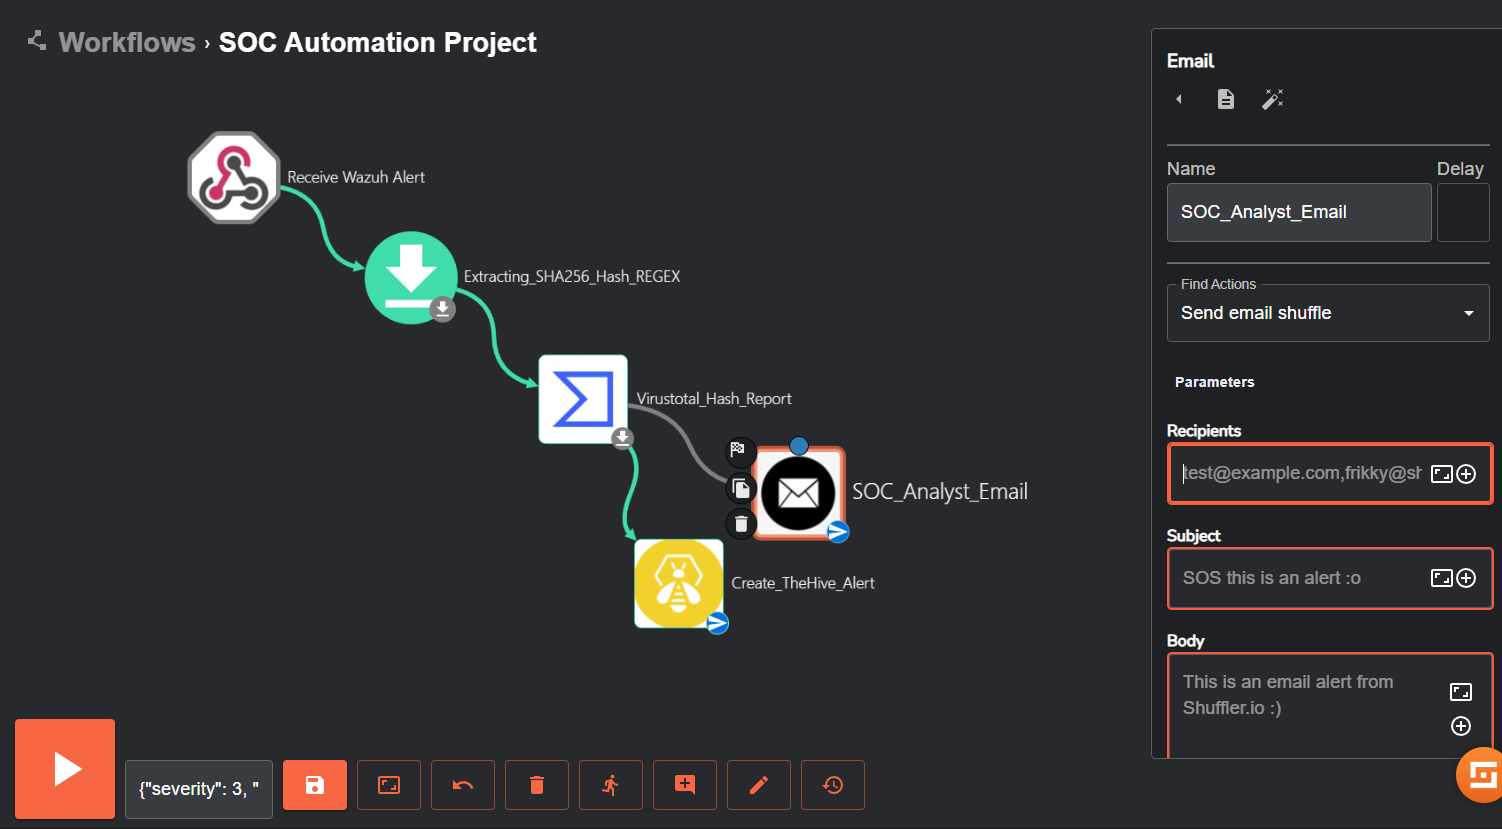
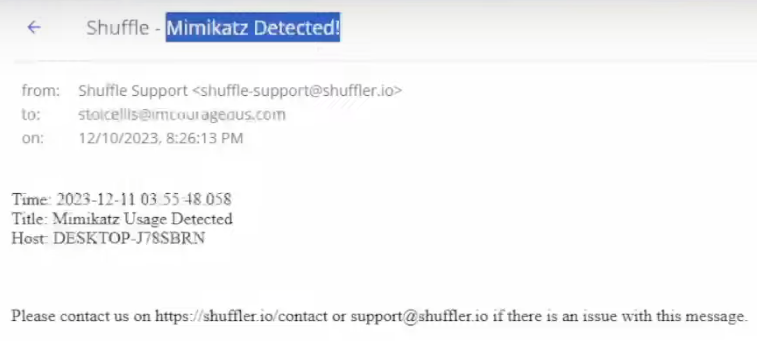
We can fill out the information needed for the recipients and subject field. Within the body, we can add our execution arguments so our SOC analyst receiving the email will be informed of the alert’s details. These execution arguments will be similar to those we set previously in our TheHive alerts – utcTime (the date), title (title of our alert) computer (hostname). Once setting these, it would look something like the following:
Results Achieved
Building this SOC Environment provided the following accomplishments:
1. Windows Virtual Machine Setup/Enhancement: Implemented a Windows 10 VM with Sysmon for advanced monitoring, deploying Wazuh and TheHive for centralized security orchestration and response (SOAR) capabilities.
2. Cloud Deployment: Provisioned Wazuh and TheHive servers on the cloud using DigitalOcean’s cloud infrastructure, including comprehensive firewall configuration and installation of vital components for both.
3. Configured and Optimized TheHive for Case Management: Configured TheHive server and various services (Cassandra, Elastic Search, and TheHive’s own settings) and optimized server performance in preparation for deployment and functionality.
4. Extended Wazuh Visibility: Successfully deployed the Wazuh agent on a Windows 10 client, facilitating comprehensive event querying and monitoring via the Wazuh Dashboard.
5. Establishing Mimikatz Telemetry Integration with Wazuh: Integrated Mimikatz telemetry with Wazuh through intricate log configuration, Filebeat setting optimization, index pattern creation, and custom alert rule development, providing threat detection capabilities.
6. Automated Security Response: Established an automated security workflow leveraging Shuffle for Wazuh alerts, authenticating with the proper APIs and regex code to feature streamlined SHA256 hash extraction, VirusTotal analysis, automated alert creation in TheHive, and email notifications, streamlining incident response.
This project has afforded me invaluable hands-on experience with a diverse array of security tools and frameworks crucial in the operational landscape of a Security Operations Center (SOC). I’ve gained proficiency in utilizing tools such as Wazuh for security monitoring and threat detection, TheHive for efficient case management, and Shuffle for seamless workflow automation. As a newcomer to these platforms, I immersed myself in their intricacies, thereby enhancing my comprehension of setting up and optimizing an operational environment. This exposure has greatly deepened my understanding of Security Orchestration, Automation, and Response (SOAR) within the context of a SOC environment, positioning me for greater effectiveness in similar roles.
Challenges Faced and Solutions Implemented
(Networking Issue) Wazuh Agent Not Displaying on Windows 10 Client
While step 3. Deploying a Wazuh Agent On Our Windows 10 Client was straightforward in the writeup of this project, this was the first issue that I ran into when setting up this SOC environment behind the scenes. After installing the Wazuh agent on the Windows 10 VM, the agent did not appear in the Wazuh dashboard, although I was able to see that the Wazuh service had started within the Windows service manager.
Steps taken to troubleshoot:
1. I went back to check the config files on Wazuh for the Wazuh server’s IP address, and the IP of the Wazuh droplet to see if they had been inputted correctly.
2. I checked the public IP of the desktop machine and the VM. As expected, both had the same public IP address.
3. I tested installing the agent on my desktop, and the agent was functional and appeared within the dashboard. This was the first difference I was able to find.
At this point, I was beginning to believe there was an issue at the network level, if the Wazuh server was able to communicate with one device and not another.
4. I decided to check the private IP of both my desktop machine and the Windows 10 VM. Here, I noticed something important – the private IP on my desktop was 192.168.XXX.XXX. The private IP on my Windows 10 VM was 10.XXX.XXX.XXX. This simple fact meant that these devices were, in fact, on different networks.
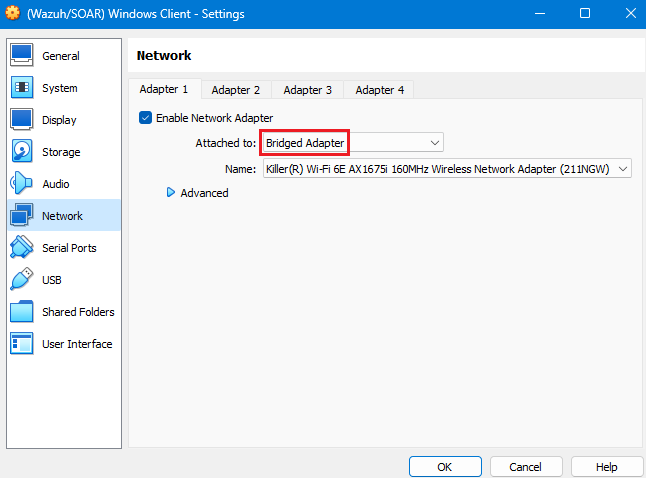
From here, I took a look at my Windows 10 VM’s adapter settings, and sure enough, NAT was being used instead of Bridged Adapter. Adjusting this adapter setting resolved the issue.
Explanation in Detail:
On its own NAT (Network Address Translation) is used to translate private IP addresses within a LAN to a public IP address used on the Internet. This allows multiple devices within a private network to share a single public IP address, conserving IPs and offering an additional layer of security. As such, NAT is oftentimes used by our home routers.
In the case of our environment, our VM (using NAT) was operating in a network environment where its private IP was translated to a public IP address (by our host machine) before being sent out into the Internet. Both the desktop machine and the Windows 10 shared the same public IP address when communicating with the external Wazuh server due to NAT – in this case, it seemed that Wazuh had detected our desktop machine as the main/initial IP, with the Windows 10 machine “sitting behind” the desktop on the network, rather than in parallel, on the same network.
Bridged adapter, instead, allows a VM to connect directly to the physical network that the desktop machine is connected to, effectively making it appear as if it were another device on the network. In turn, this allows the VM to use its own IP address, resolving the issue.
(Service/Platform Issue) TheHive Login/Authentication Error
When logging into our TheHive dashboard for the first time, I experienced an authentication failure, even after configuring it properly and ensuring the three services (cassandra, elasticsearch, and thehive) were up and running:
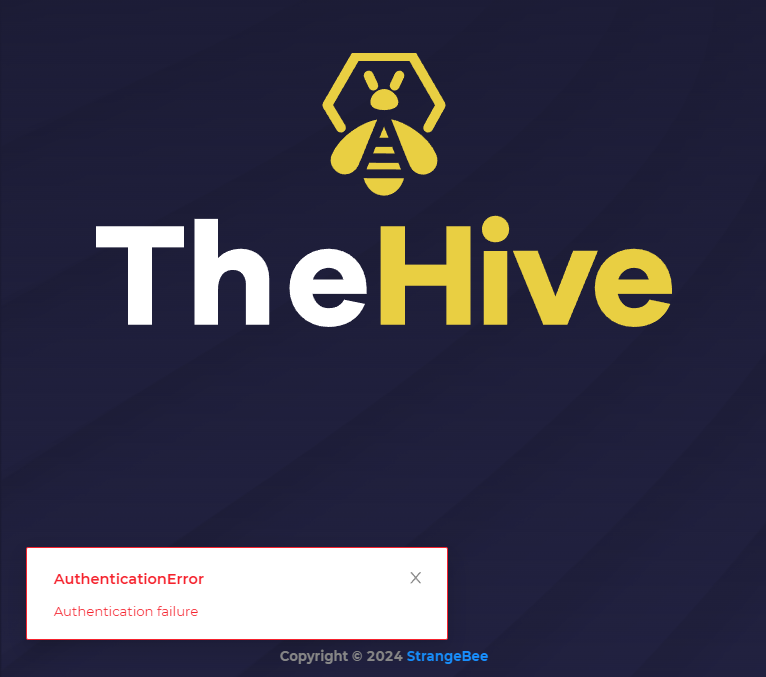
When seeing this, I checked the status of elasticsearch once again, and sure enough, the service had gone down:
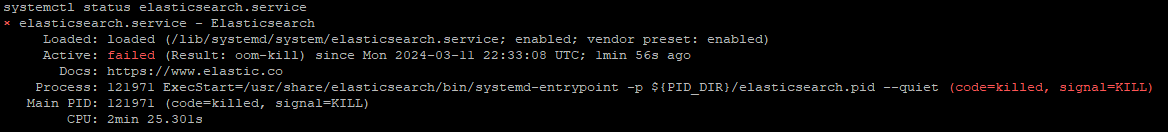
After doing a bit of research, I found that many issues related to Elasticsearch during initial setup can be related to memory allocation and resource management, as Elasticsearch is mentioned by others to be a memory-intensive application. To resolve the issue, we can run the following command:
nano /etc/elasticsearch/jvm.options.d/jvm.options
Once the file has been created, the following content is pasted in:
Dlog4j2.formatMsgNoLookups=true
Xms2g
Xmx2g
This will essentially tell Elasticsearch to allocate 2GB of memory for Java, as our VM uses a total a 8GB and we just want to ensure there are no issues in this regard. After checking the status of Elasticsearch, I was able to successfully log into my TheHive dashboard with no continued issues.
Lost Wazuh Login Credentials
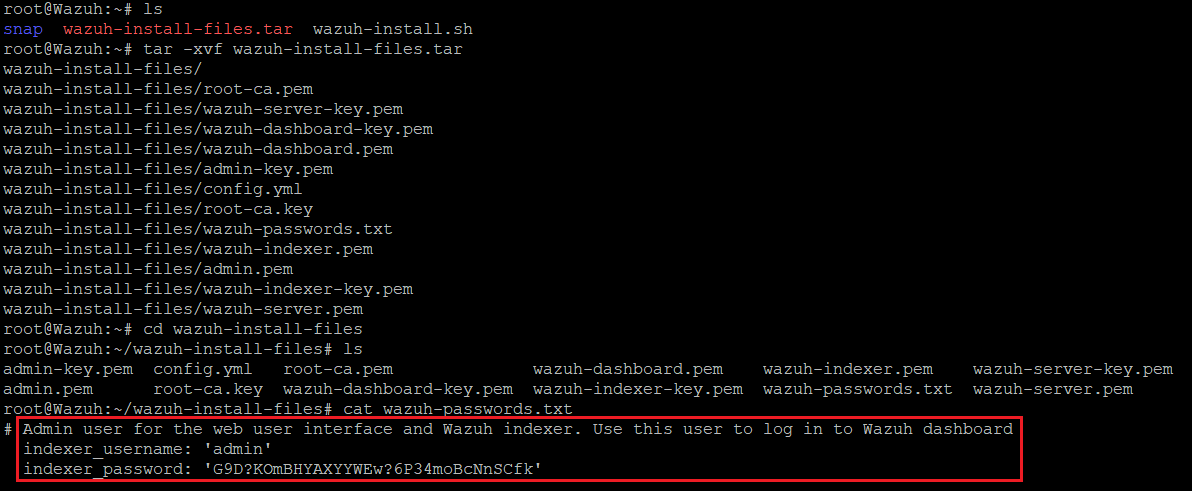
During the Wazuh setup, credentials are provided to allow the user to log into the Wazuh dashboard. However, if the credential are somehow misplaced on your end (which unfortunately happened amidst my screenshotting and note-taking), some quick detective work and Linux commands can let you find them quickly. If we type ls in our Wazuh server, we will see a list of visible archives. A notable one is wazuh-install-files.tar – this stated to be the archive that holds wazuh-passwords.txt, which is the file the Wazuh installation agent has created to store generated passwords during setup, as per Wazuh’s documentation.
Extracting all files from wazuh-install-files.tar
$ tar -xvf wazuh-install-files.tar
Changing directories to the extracted archive (wazuh-install-files)
$ cd wazuh-install-files
Displaying the contents of wazuh-passwords.txt
$ cat wazuh-passwords.txt
Closing Thoughts
This project journey through creating a SOC environment and learning about SOAR implementation has been both enlightening and challenging. From troubleshooting config files and network configurations to creating/editing alerts and log files, each obstacle offered a great opportunity for hands-on learning and skill development.
Achivements like seamlessly integrating tools such as Wazuh and TheHive, and establishing an automated response workflow through Shuffle, underscore my dedicate to mastering cybersecurity operations. As the threat landscape evolves, these experiences will serve as a solid foundation for tacking real-world security incidents with confidence and precision.
Moving forward, I feel eager to delve into projects that further expand my skill set in this area. For instance, exploring threat intelligence/hunting and the implementation of MISP (Malware Information Sharing Platform & Threat Sharing) into my SOC environment excites me – this would not only enhance the environment’s threat intelligence capabilities, but also deepen my understanding of threat analysis and information sharing practices crucial in modern security operations.
Source Citations
Kidd, C. (2023, December 6). SOAR: Security Orchestration, Automation & Response | Splunk. Splunk. https://www.splunk.com/en_us/blog/learn/soar-security-orchestration-automation-response.html
MyDFIR. (2023, December 24). SOC Automation Project (Home Lab) | Intro [Video]. YouTube. https://www.youtube.com/watch?v=Lb_ukgtYK_U